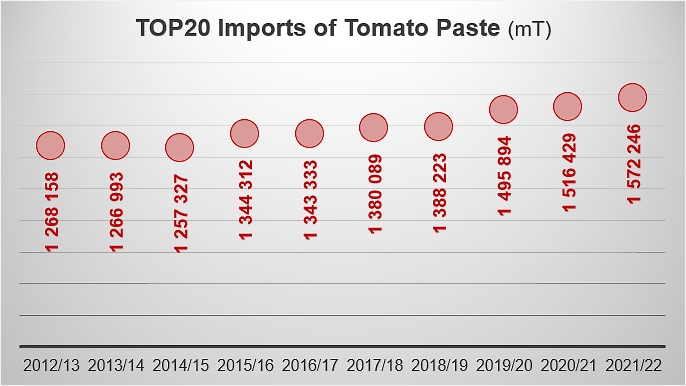
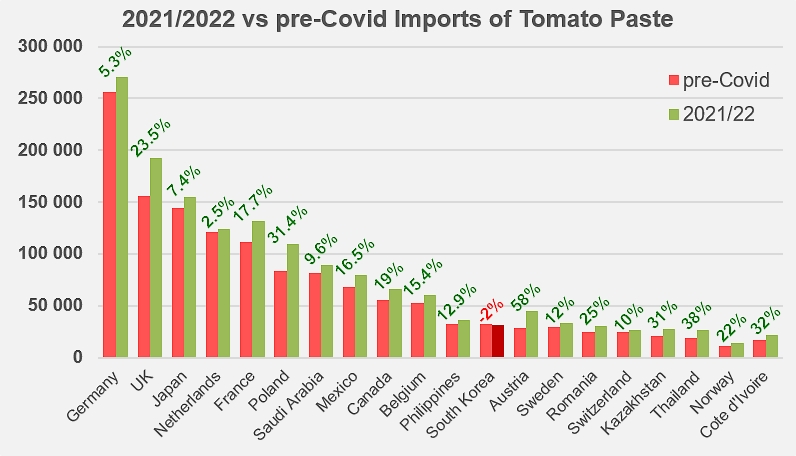
2021/2022 imports were 15% higher than during the pre-Covid period.
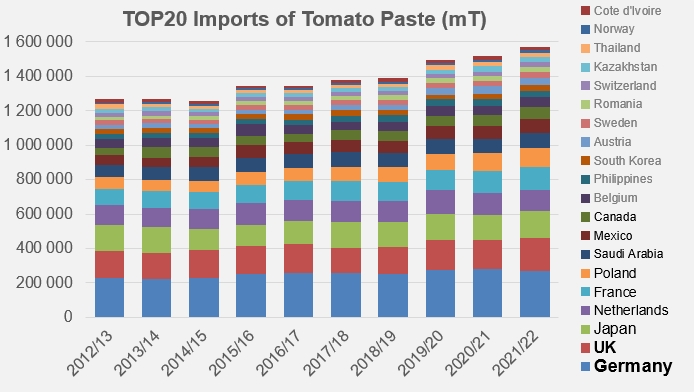
Paste imports of the TOP20 countries in 2021/2022 (July/June)
Imports of the top 20 paste importing countries (HS codes 200290) increased significantly in 2021/2022, with an annual variation of 3.7% (+55,800 mT) from the 2020/2021 marketing year and an increase of 7.2% (+105,400 mT) compared to the three previous marketing years (from 2018/2019 to 2020/2021). This intensification of trade flows is all the more remarkable for the fact that this recent three-year period was strongly marked by the consequences of the Covid pandemic, which already clearly amplified demand: in the end, the quantities shipped in by all the TOP20 importing countries reached the historical level of 1.572 million mT, a result almost 15% higher (about 202,000 mT) than in the pre-Covid period (2016/2017-2018/2019, 1.370 million mT).
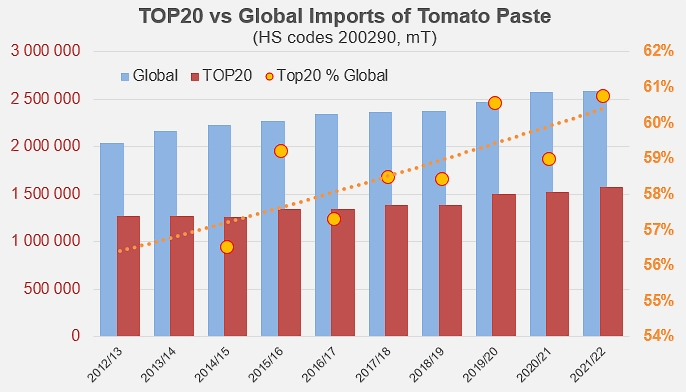
The acceleration in supply observed last year was much more pronounced in the TOP20 countries than it was globally: with a little more than 2.588 million mT traded, global imports have indeed increased by only a little less than 1% compared to marketing year 2020/2021, by 4.7% compared to the average of the three previous marketing years, but most notably by only 10% compared to the global performance of the three marketing years that preceded the pandemic (period running 2016/2017-2018/2019, 2.36 million mT).
Imports from the twenty most dependent countries – those whose domestic consumption depends solely on foreign supplies, thus excluding countries that are also processors, such as Spain, the USA or Brazil – have increased significantly over the past year.
Over recent years, imports have grown faster in all the TOP20 countries than they have in the rest of the world. An immediate direct consequence of the consolidation of these foreign purchases is the increase in the proportional importance of the TOP20 in the global landscape of the paste trade. Even if changes in the countries that make up the TOP20 or in the context of the paste category may slightly modify the importance of its contribution to annual world demand, the recent evolution of the quantities traded clearly shows an increased dependence on foreign supplies. While the volumes of paste imported by the TOP20 (1.257 million mT) represented about 56% of the annual global flows in 2014/2015, they represented, with 1.57 million mT, almost 61% of global trade last year, and the trend that emerges from the last few marketing years is clearly on the increase.
Compared to the pre-Covid period (2016/2017-2018/2019) taken as a reference, the most striking increases (taking into account both the usual activity and the percentage increase) are to be credited to Austria (up by almost 16,500 mT and more than 58%), the United Kingdom (+36,600 mT, +23%), Poland (+26,200 mT, +31%), France (+19,800 mT, +18%), Thailand (+7,200 mT, +38%), Kazakhstan (+6,600 mT, +31%). Only South Korea's performance was slightly down.
In this critical sector of the world market that is represented by the TOP20 paste importing countries, the average annual growth rate (CAGR) over the last five years has been 3.2%, while it has been only 2% worldwide and only 0.3% for the other ninety countries that are not part of the TOP20.
Some complementary data
The list of countries that make up the TOP20 evolves according to national dynamics and the availability of statistics. Around a historical core composed of Germany, the United Kingdom, France, Japan, the Netherlands, etc., this group now includes Saudi Arabia and Ivory Coast, while Russia, Costa Rica and Ghana are no longer included.
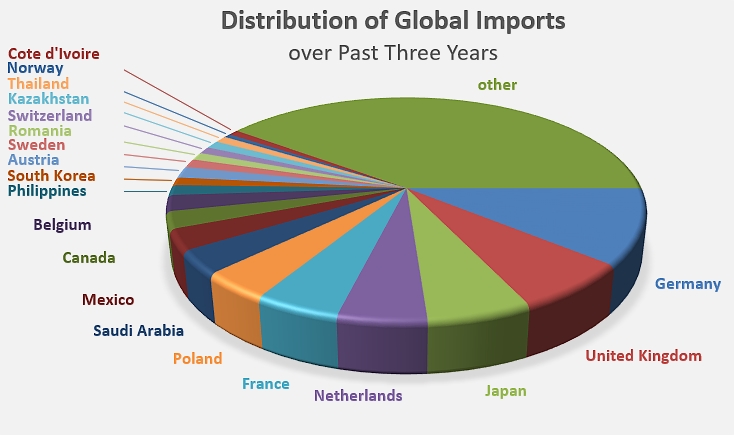
Distribution of average global imports over the last three years: the twenty most import-dependent countries – in other words, those whose domestic consumption depends solely on foreign supplies – accounted for more than 60% of worldwide shipments of tomato paste.
The top five countries in the group (Germany, United Kingdom, Japan, the Netherlands and France) alone account for more than one-third of annual global imports.
Sources: Trade Data Monitor