2021 Season , 2021 TomatoNews Online Conference
Processing Tomato Production and Markets in North America
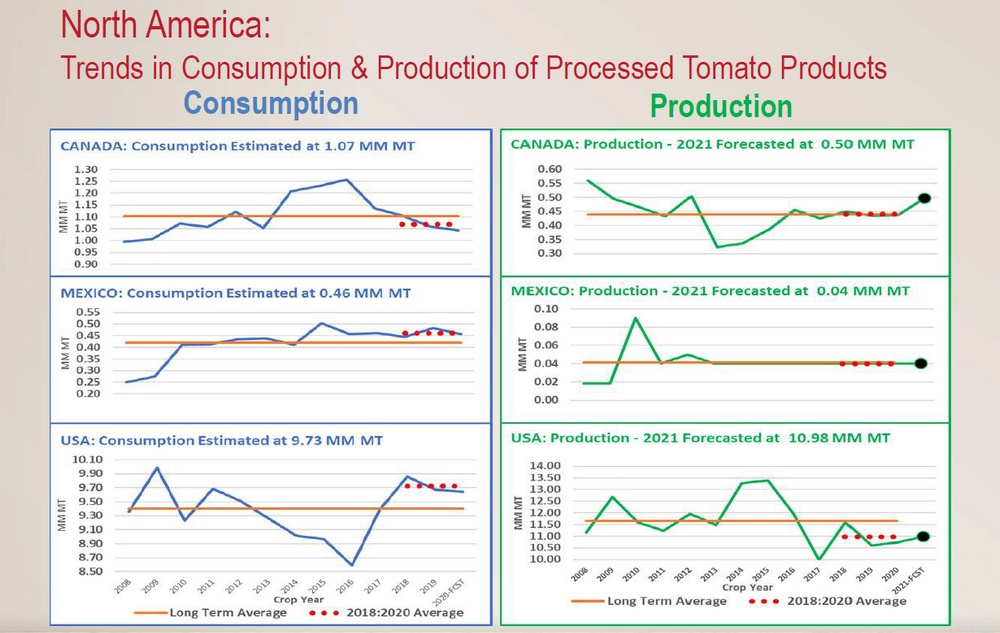
“The first slide provides just a quick overview of trends in consumption and production for the three main actors in the North American market: Canada, Mexico and the United States. The trends shown are for crop years 2008 to 2020, with forecast estimates for 2020 consumption and 2021 production.
The production numbers used in this presentation and article are all either taken directly from the WPTC reported values (in the cases of Canada and Mexico), or from USDA’s National Agricultural Statistical Services (NASS) for the United States and for the reports of production in the Midwest and California. Consumption values are all internal MorningStar estimates.
For the most recent three years (2018 to 2020), estimated consumption for all three countries in the North American region has been flat, or even slightly down. US consumption is about nine times that of Canada, and about twenty times that of Mexico.
Canada is currently forecasting an 11% increase in production, compared to its recent three-year average. The US is projecting no particular change to recent years in terms of production. The US production is about twenty-two times that of Canada’s. Mexico is a significant consumer and importer, but is not really a significant contributor to North American production.
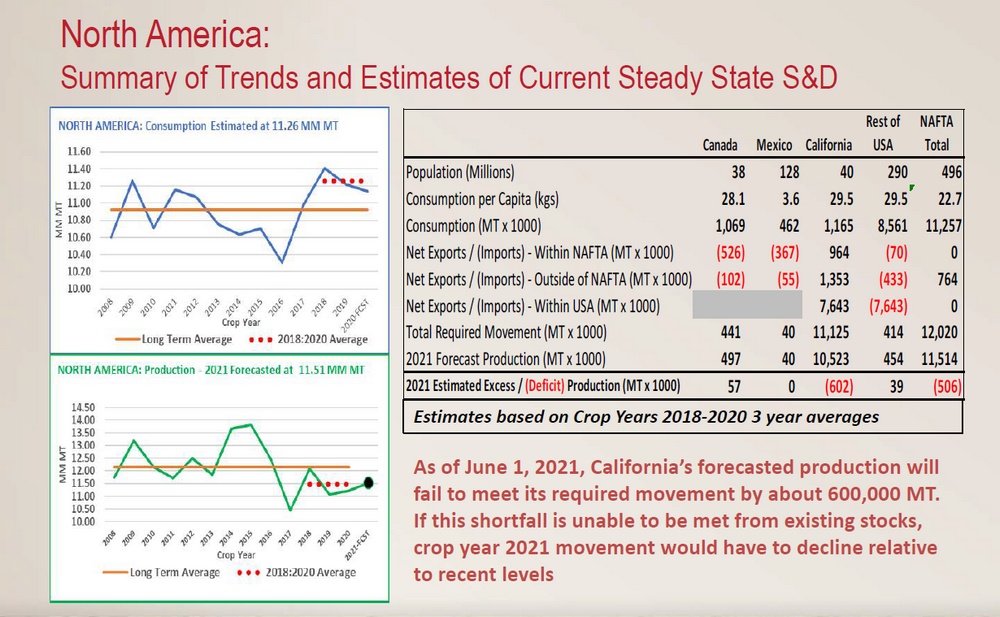
The previous charts are summarized in the two graphs on the left of this slide. The current steady state rate of North American consumption is estimated at about 11.3 million metric tonnes on a raw tonne basis, and likewise a steady state production is estimated to be about 11.5 million metric tonnes. The right-hand side of the slide summarizes estimates for the key elements of overall supply and demand for processed tomato products within North America. (In this instance, the USA is divided up into California and the rest of the country.)
The table highlights a few facts about the current steady state of supply and demand within North America. It shows that Canada, Mexico and the rest of the USA are all net importers, both from within NAFTA and from suppliers outside of North America. California is the only net exporter within North America. 90% of California’s total annual movement comes from exporting to consumers outside of the state. The chart also highlights that Canada’s forecast for 2021 production is about 13% higher than its recent steady state level of movement. So without an increase in demand, this is going to lead to a reduction in net imports to Canada. On the other hand, California’s forecast for 2021 production is 5% below its steady state level of movement. Beginning stocks could potentially cover the shortfall but they have become pretty tight, so if stocks are not available to cover the shortfall, net exports are going to have to contract.
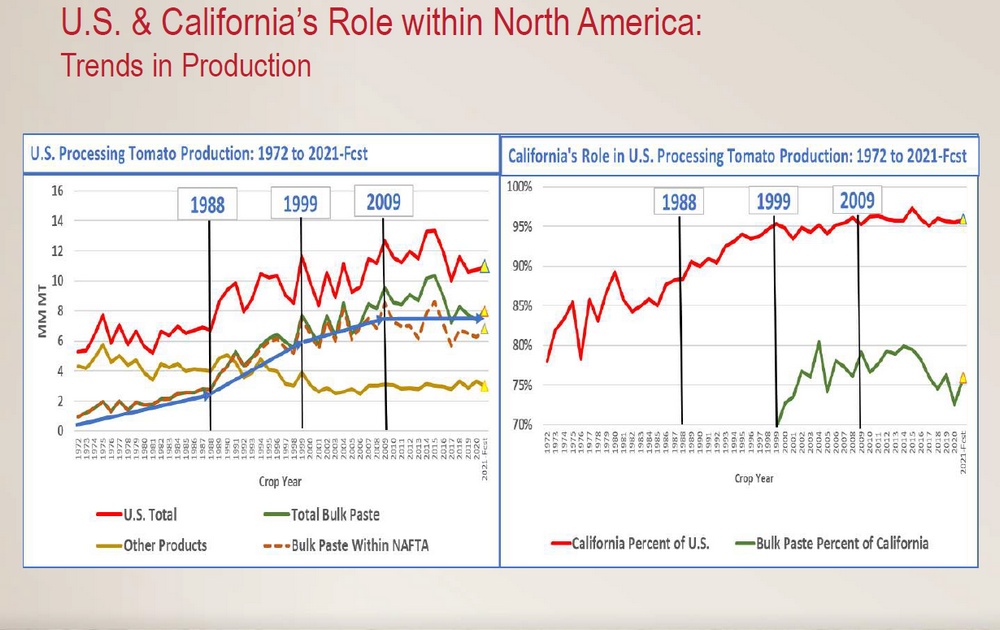
These two charts display a fifty-year history of the growth and transitions in US tomato processing production, and the role California has played in that story. When the charts are considered together, the key points are the following:
- Since the early 1980’s, all growth in the industry has come from bulk tomato paste.
- By 1999, production of products other than bulk paste (canned tomatoes, whole-peeled tomatoes, fresh packed, sauces) had stabilized at about 3 million metric tonnes and has remained at around that level ever since.
By 2009, production of bulk paste for the North American market had essentially plateaued. The current steady state movement rate is estimated at about 6.8 million metric tonnes. So all growth of bulk paste production after 2009 has been driven by export opportunities outside of North America. In terms of California’s role, the state has increased its percentage of the total US production (right-hand chart). Again by 2009, California’s share of total US production had stabilized at around 96%, and also by that time, the proportion of bulk paste in California’s total production had stabilized in the range of 75%-80%, with fluctuations depending on the expected level of demand outside of North America.
The previous slide highlighted the importance of bulk tomato paste to the North American market in general and to California in particular. These two slides offer some key performance indicators for the bulk paste market segment.
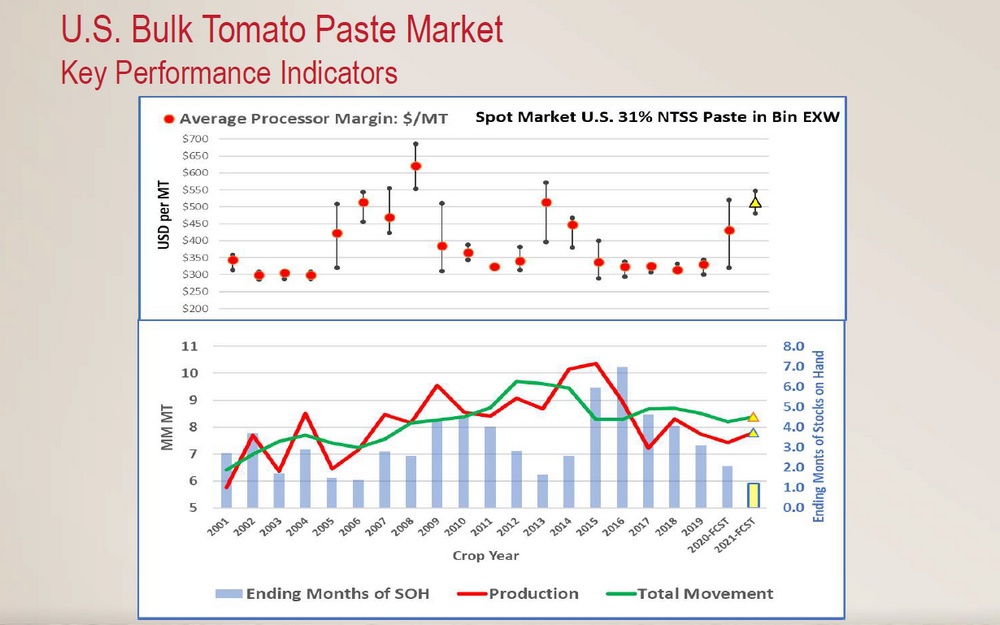
The data relates to actual performance for crop years 2001 to 2019, with estimates for the balance of the 2020 crop year and a forecast for the 2021 crop year.
The top chart indicates the trends in what we refer to as processor margin, in dollars per metric tonne. Processor margin is defined as the spot market price of 31% NTSS paste, packed in returnable wooden bins, sold on an ex-works basis, from which the raw product component cost of the paste has been deducted. These values are publicly available and taken directly from those reported by Western Consolidated Foods on their website.
At Morning Star, we believe that the benefit of looking at processor margins rather than just market price is that this corrects for increases in the market price that are driven solely by the incremental raw product costs.
The bottom chart shows trends in bulk tomato paste total movement and production as well as crop year ending inventory positions. In this instance, inventory positions are expressed in terms of months of ending stocks-on-hand. The lines represent movement and production, and the vertical bars represent the ending months of stocks-on-hand. Looking at the processor margins chart, and comparing it to the ending months of stocks-on-hand charts below, it is clear that the sharp increase in processor margins projected for 2021 is driven by the forecast low inventory position going into the 2021 crop year and by the forecast record low inventory position going out of the 2021 crop year. Again, that increase is expressed in terms of processor margin, taking into account the very sharp increase in raw product price. In the case of California, with prices for raw product going from 78.50 USD per short tonne to 84.50 USD per short tonne, that increase in raw product price will equate to a 44 USD increase per metric tonne [of tomato paste, Ed.], or to a decrease in the processor margin without a corresponding increase in price. So to achieve the kind of processor margin increase that we are looking for, it must come on top of covering any increase in raw product cost.
The estimated historically low 2021 ending inventory position reflects the expectation that, for the fifth consecutive year, California’s production of bulk paste is going to be below its currently estimated required movement rate.
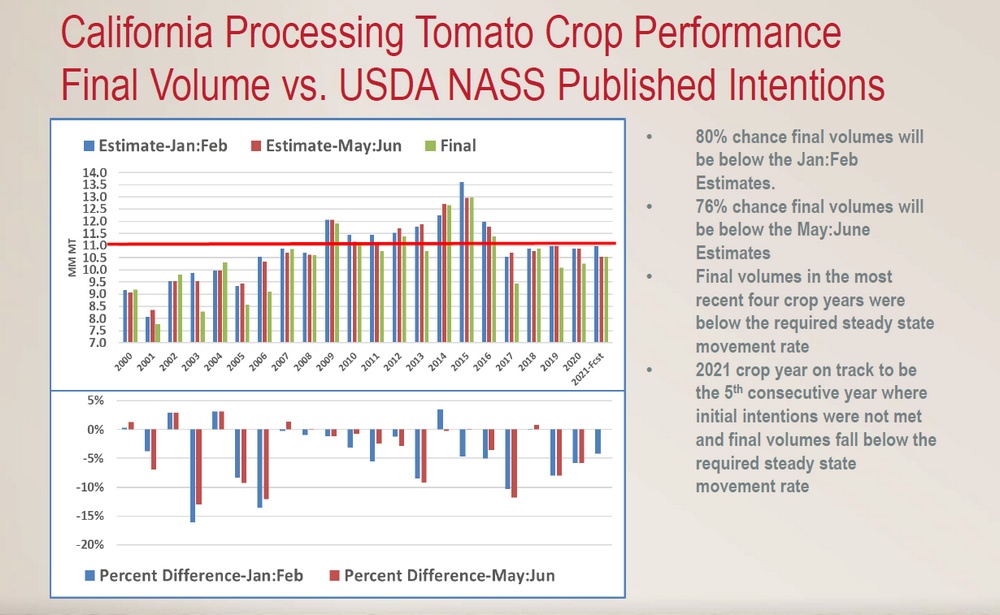
These charts look at some trends in California’s production and contrast them to the initial intentions published by the USDA in January, and then again typically to the revised estimate of production that is published in May. In looking at the causes of California’s recent shortfalls in bulk paste output compared to its demand, it seems clear that crop performance has been the driving factor. For the 2019 and 2020 crop years, initial tonnage intentions were right at (or were very close to) the required steady state movement rate. But in each of those years, the crop fell short by more than 5%. Initial intentions for the 2021 crop year were at 11 million metric tonnes, which is just slightly below the required movement rate. But as of May 2021, intentions have been revised downwards, to 10.5 million metric tonnes, and this cutback was not due to lack of processors’ demand or production capacity. It appears that the primary cause is the worsening drought situation in the western United States and its impact on Californian tomato growers.
The current forecast ending inventory position for 2021 assumes that the May 2021 intentions will be met. However, going into the season and looking at historical records, there is about a 76% chance that final production will be below May’s intentions.
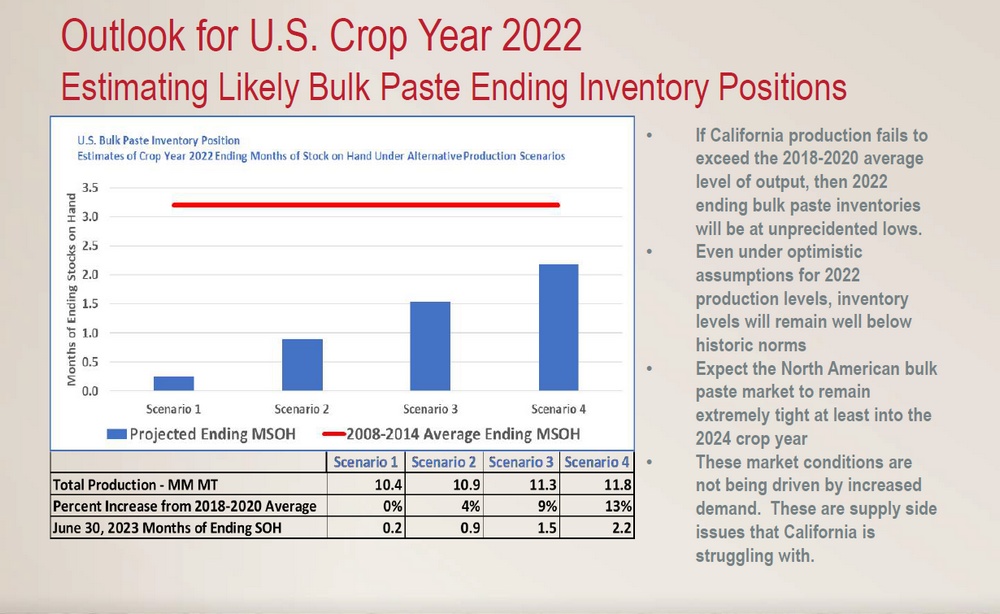
The final slide looks to the 2022 crop year and provides estimates of outcomes under various production assumptions for 2022. All of the scenarios assume that the 2021 estimated performance is achieved, and that the outcome considered is the projected 2022 crop year bulk paste ending inventory position, expressed in months of ending stocks-on-hand. The left-most column (scenario 1) indicates that, at a production equal to the 2018-2020 three-year average – only slightly below the current 2021 intentions, ending stocks-on-hand going out of the 2022 crop year would be at about 0.2 months. That is less than one week of supply-on-hand going into the new processing season.
At a production of 10.9 million metric tonnes, which was the original 2021 intention, ending stocks would still be at less than one month going into the processing season.
And even at a production level of 11.8 million metric tonnes, which is about a 13% increase over the prior three-year average, ending stocks would still only reach about 2.2 months, which is far below the pre-2015 long-term average [estimated requirement, Ed.] of about 3.2 months of stocks-on-hand going into the new processing season.
So, based on these estimates, the availability of bulk paste on the North American market is expected to be very tight well into the 2023 crop year and perhaps beyond. Given the historical relationship between inventory levels and product pricing, we expect bulk paste pricing to remain very strong again well into 2023 and perhaps beyond.
Again, the focus is on processor margin, not just price. So even allowing for increases in the raw product cost, we are still expecting to see a very tight market that would drive both pricing and processors’ margins up.
As for “euphoria”, given the constrained approach to the market, we think it is very important to note that the current supply imbalance position shown here is not being driven by demand. As previously stated, at least in the North American market, demand is flat to slightly down. The imbalance is being driven by current supply side constraints within California’s farming set. Processors and growers are currently working together to find solutions. These are complex issues and they are going to take some time to fully address.”
Source: TomatoNews Online Conference (June 8, 2021)
All presentations and videos will be made available here from August 1st, 2021.
For further details about the Conference:
Further details in attached documents:


