Respect for your privacy is our priority

The cookie is a small information file stored in your browser each time you visit our web page.

Cookies are useful because they record the history of your activity on our web page. Thus, when you return to the page, it identifies you and configures its content based on your browsing habits, your identity and your preferences.

You may accept cookies or refuse, block or delete cookies, at your convenience. To do this, you can choose from one of the options available on this window or even and if necessary, by configuring your browser.

If you refuse cookies, we can not guarantee the proper functioning of the various features of our web page.

For more information, please read the COOKIES INFORMATION section on our web page.


News

The 2022 Tomato News Conference: the 2022 processing tomato season in California

21/12/2022 - François-Xavier Branthôme - The 2022 Tomato News Conference - Parma
Transcript of the presentation by Mark De La Mater (Morning Star Company) during the 2022 Tomato News Conference held in Parma on 25 October 2022

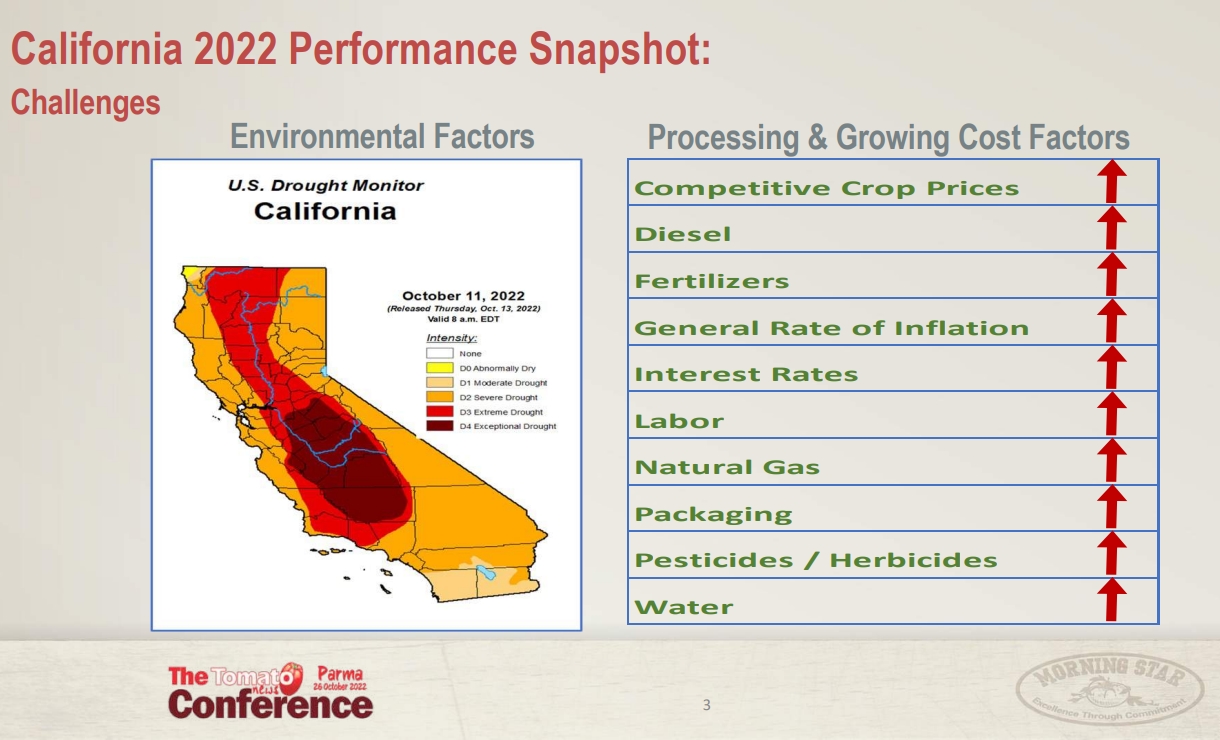
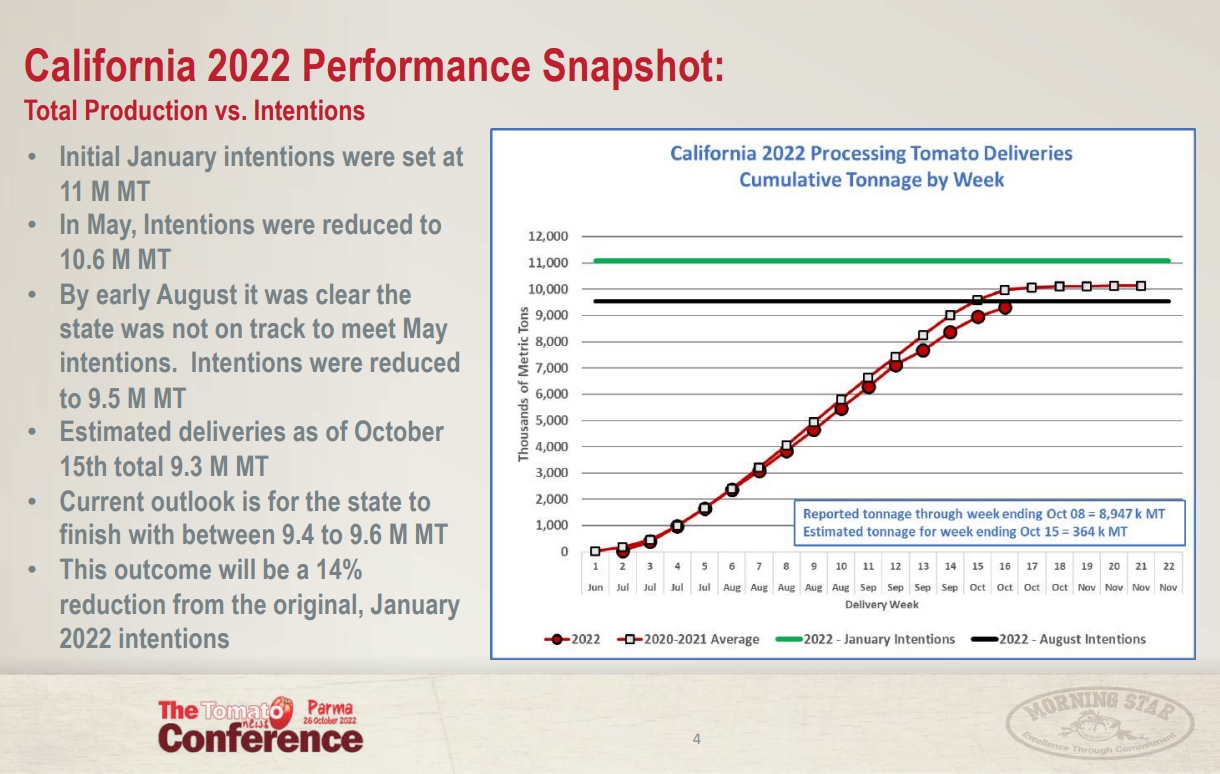
 “I am here to provide an update on the 2022 processing tomato season in California, and also to talk about how the results for 2022 are likely to play forward into the expectations for the 2023 and 2024 crop years.

So we will start by taking a brief snapshot of the year-to-date performance. And then we will take the time to add a bit of additional context to the 2022 results. Then, with 2022 as the starting-off point, we are going to talk about 2023 and 2024 expectations. Finally, we will end up with a quick summary and some tentative conclusions.
I think we have heard it throughout the conference: like virtually every other processor, California faced more than its share of challenges in 2022. If you are looking at environmental factors, 2022 was the third consecutive year of statewide drought conditions. And if you look at tomato processing, virtually 100% of all the areas that grow tomatoes in California experienced either extreme or exceptional drought conditions. And drought was not the only issue we faced – again I think like so many other regions. For example, in the first part of September, we were hit by a week-long statewide heatwave. Temperatures in the northern part of the State around the Sacramento area and in the southern part of the State around the Fresno area (which are two of the main growing regions in the State) were hit by record high temperatures that reached 47°C. Then, within about ten days, we were hit by a statewide unseasonable rainstorm, and that storm knocked out harvesting for about two to three days in the northern part of the State.
Then, regarding growing and processing cost factors, if you look down the line at all the significant cost inputs, either for processors or for growers, they all experienced extremely high price increases during the 2022 crop year. In most cases, if you are looking at those price increases on a percentage basis, they were at least double digit and in some cases for some items even triple digit.
 

So now, just looking at the update for production for the 2022 season, initial January intentions came out at 11 million metric tonnes, which was in line with what intentions were for 2021 and 2020. But by mid-May, intentions were downgraded to 10.6 million metric tonnes. Then, once the season started, if you look at that cumulative chart, by the time we got to early-to-mid-August, it was clear the State was not on track to hit the May intentions. And by the time we got further into August, it became clear that the State was not even on track for the average production of the previous two years. So in late August, intentions were reduced again to 9.5 million metric tonnes.
As of October 15, which is the last date of official published data, the total production for the year-to-date period stood at about 9.3 million metric tonnes. So as of today, the State is expecting to process through the first week of November, and right now the outlook for total production for 2022 stands at between 9.4 and 9.6 million metric tonnes. I can also say that with some more current unofficial information, my guess would be that it is going to come in very close to the 9.5 million metric tonne intentions. At that level of output, that would be a 14% miss from our initial January intentions.
 

Having talked about production, we are going to move forward and try to add some context to some of the things we have just talked about. This first slide looks at total installed processing capacity in California, over the thirteen-year period from 2010 to 2022. We have broken up this thirteen-year period into four comparison periods. The first one, 2010 to 2013, is what I would call a four-year baseline. The next two-year period to 2014 was a period where a lot of capacity got added in the State (and a lot of that capacity came from my company). Then, from 2016 to 2019, we had a drop in capacity from the 2015 peak, going down until 2019, but then capacity held steady through 2019. Now, in the most recent three-year period, 2020 to 2022, we again saw a drop in capacity from 2019 levels, down until 2020. But since then, capacity has remained very steady.
When we are looking at these charts, we are focusing on comparing the 2020 to 2022 period versus the 2010 to 2013 baseline. And one of the key facts to take away from this chart is that when we look at installed processing capacity for 2020 to 2022, it is at approximately 98% of where things were back in the 2010-2013 baseline period. Again, 2020-2022 installed processing capacity is pretty close to where it was back in 2010-2013. And that is another reason why we chose 2010-2013 as a baseline.
 

The next context we are going to look at is the pattern of weekly tomato deliveries over each of those four comparison periods. What we are seeking to estimate is “What was the peak average weekly production capability in each of those four periods?” And what we must observe, in order to estimate that, is the actual average weekly production for the three highest consecutive weeks. We can then use that as our estimate for what the peak production capability at the State was over that time-period. Again, we want to focus on the differences between 2020-2022 versus 2010-2013. The 2020-2022 installed processing capacity of about 847,000 raw metric tonnes per week is at about 87% of the peak processing capability that was in place in 2010-2013. That is a 125,000 metric tonne reduction in peak processing capability. If you recall, when we were comparing processing capacity, 2020-2022 stood out at about 98% of the in-place processing capacity in the baseline. This implies that of the 125,000 metric tonnes of lost peak production capability, only about 20,000 metric tonnes are associated with reductions in processing capacity. The other 105,000 metric tonnes of lost production capability cannot be explained by the reductions in processing capacity. They have to be explained by other factors.
 

The last little bit of context we are going to look at is what I will call market factors that are known to influence supply decisions. We have created indexes for three of these key factors. One for the price of raw product, one for the bulk tomato paste price and one for bulk tomato paste ending inventory positions. On the charts, the green line with green square markers is the index for raw product pricing. The red line with the red circular markers is the index for bulk paste pricing. And the solid grey line is the index for the bulk paste inventory position. For all of these indexes, bigger is better. So the larger the value, the stronger the support for increasing supply, for increasing production. If you look at the thirteen-year period, only the 2014-2015 and the 2021-2022 periods showed all three indexes supporting a desire for increased supply, for increasing production. I think most of us know what happened to California production in 2014 and 2015. I’m going to step back now, because it went through the roof. So, when we look at 2020-2022, and we compare those index values to what they were in 2014-2015, we would be expecting to see increased production at least on a scale that we saw back in 2014-2015. But we don’t see that increase in production. Despite the fact that both growers and processors should have been highly incentivized to maximize production, that increase in production did not occur. In fact, instead, 2021 and now 2022 have both ended up with year-over-year reductions in output. And if you look at the two years combined, the shortfall from the initial intentions in those two years totaled up to 2.8 million metric tonnes.
One of the consequences of this performance for the State is that the expectations for inventory positions, as we head out of the 2022 crop year, are that they are going to be at record low levels.
 

With that, we can now move forward to look at 2023-2024. The first thing I want to say is that these next three slides are not forecasts – and they are certainly not the Morning Star forecasts, not even estimates. This is just saying “What If”. 
What if certain things happen and what would the outcomes be. We are looking at total production in California. The blue line shows total production. The red line shows production of bulk tomato paste. The relationship between total production and bulk paste production has been very stable over the past 20+ years. Our choices for total production will drive the values for bulk paste production. What we are asking here is “What if 2023 and 2024 both come in at 11.2 million metric tonnes of total production?” That is right in line with the 2021 and 2022 intentions. It is right in line with what we know about the installed processing capacity that exists today. And it is also right in line with where we know the market factors are, as far as supporting increased production reliance. One thing we can tell from the chart, when we look at the 11.2 million tonne target here, is that it is pretty obvious we are going to have to reverse the pattern of California’s production in recent years. But if you look across the comparison period 2010-2013, the estimates for 2023-2024 look very reasonable, and they should be achievable targets.
 

The next thing we are looking at is bulk paste movement. Here, movement is just US consumption plus net exports. Just focusing on the patterns in the chart, what we are asking here is “What happens if bulk paste movement just returns to the average 2017 to 2020 levels?” And all that would require would be for net exports to be right where they were on average across 2017 to 2021: about 2.1 million metric tonnes run-rate, which was very steady. And the other thing it would require would be for US consumption to rebound back from what appears to have been the estimated dip that it recorded in 2021. So it would require US consumption to get back to its long-term average run-rate of about 6.4 million metric tonnes. Essentially, if you just look at the pattern and the highlighted areas, you will see that the assumptions for 2023-2024 movement rates would seem to line up very well with what was actually achieved in 2017-2020.
All we are asking here is “What if movement just gets back to normal?”
 

Our last “look forward” is at bulk-paste ending-inventory positions. Here, the orange columns represent months of ending-stock on hand, and the blue line represents ending inventory volumes in raw equivalent metric tonnes. This, unlike the other two slides, is not a “What If”. This is what the impact will be, given our assumptions about 2022 results, and the choices we make for 2023 and 2024 production and movement. In the chart, your eyes get immediately drawn to the 2021-2024 pattern, which deviates significantly from the historical. When I look at this chart, I see that the cycles in the bulk tomato paste market that we have all come to accept may have actually broken, at least in the short term. Because of this, what appeared to be at least a fairly long-term low-inventory position, is likely to cause a continued significant amount of upward pressure on bulk paste pricing, going at least into July 2025. The other bigger concern is that this extended period of low ending-inventory positions is going to increase the likelihood of some disruptions in the supply chain, and that will obviously not be good for anyone.
 

So, just to summarize…
California, like everybody else, had its challenges in 2022. The expectations now are that California will end up at 9.4 million tonnes, which is down 14% from initial intentions. When we compare the 2010-2013 proven peak production capability, California today has declined by about 11%, and that is even after adjusting for the impact of reduced production capacities.
We also saw that the market factors that were in effect in 2021-2022 should have provided very strong motivation for growers and processors to maximize production. That did not happen and, in fact, 2021 and now again 2022 have actually experienced year-over-year reductions in volumes.
The consequences of all this have led to extremely low inventory positions coming out of 2022 and we are not going to have to wait very long to see that this is going to be true.
But on top of that, we see that even with very reasonable assumptions about 2023 and 2024 production and movement levels, the inventory levels do not rebound, they stay at those very low levels. They are record low levels.
And all of this drives us towards the assumption or belief that we are going continue to see very strong upward pressure on bulk paste prices through July 2025. We are also going to be facing the potential – not the certainty, but the potential – of some disruptions in the processed tomato supply chain.

I would like to close with just two final comments. One is that I think all the evidence points to fact that the issues that California has been dealing with are not driven by the processing sector. Adding more processing capacity or focusing on processing efficiency is not going to address the current problems the State is facing.
The issues we are facing are in the growing sector. For those of us here from California, I would say that if we want to improve the reliability, the sustainability of our supply chain, we are all going to have to work together to help the growing sector to at least get back to the levels of productivity and – more importantly – reliability that it had in the past
.”

Mark De La Mater's presentation:


Some complementary data
You can find all the other presentations and slides from the 2022 Tomato News Conference held in Parma on 25 October 2022 by
clicking here.

Source: Tomato News
Related companies

The Morning Star Packing Company

Tomato processor See details
Related articles

The 2022 Tomato News Conference: interview between Martin Stilwell and Mike Montna

13/12/2022 See details

The 2022 Tomato News Conference: The impact of rising energy costs on agrifood commodities

06/12/2022 See details

Enhancing production of processing tomatoes in California

30/11/2022 See details

California 2022 Season Highlights

24/11/2022 See details

The 2022 Tomato News Conference: \"Euphoria in the midst of a recession\"

18/11/2022 See details

California: what does the future hold for tomato processing?

10/11/2022 See details

WPTC crop update as of 25 October 2022

31/10/2022 See details
Back

________________________________________

Editor : TOMATO NEWS SAS -  MAISON DE L'AGRICULTURE - TSA 48449 - 84912 AVIGNON Cedex 9 - FRANCE
contact@tomatonews.com
www.tomatonews.com


Supporting partners
Featured company
CONESA
Most popular news
Featured event
15th World Processing Tomato Congress and 17th ISHS Symposium on Processing Tomato
Our supporting partners
immediate bitwave Library Z-Library