How the EU’s carbon border tax will affect the global metals trade
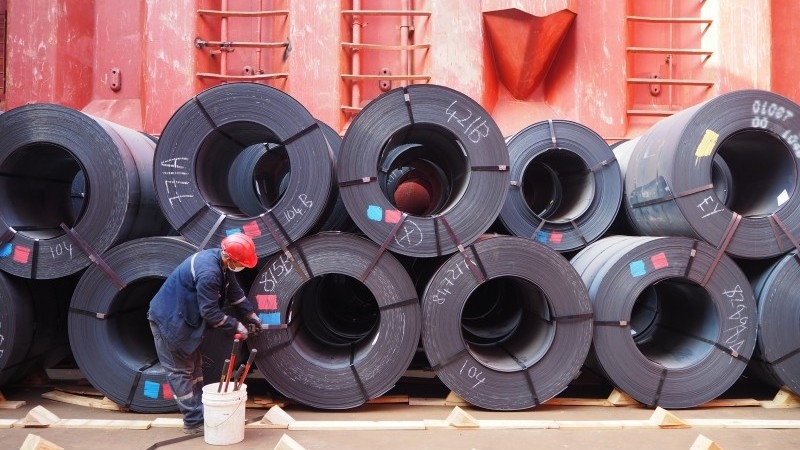
Steel is one of the six carbon-intensive industries CBAM will initially apply to, as there is a larger risk of carbon leakage.
As explained in a recent analysis report by ING Bank, the European Union's implementation of a Carbon Border Adjustment Mechanism (CBAM) to reduce the risk of carbon leakage as it strengthens its Emission Trading System is likely to push consumer prices higher and affect metal trade flows. It will also force producers globally to accelerate efforts to cut their carbon footprint.
 What is CBAM?
The CBAM is set to complement the EU’s Emission Trading System (ETS), in order to help hit the bloc’s 'Fit for 55' target of reducing carbon emissions by 55% by 2030 compared to 1990 levels and eventually achieving net zero by 2050.
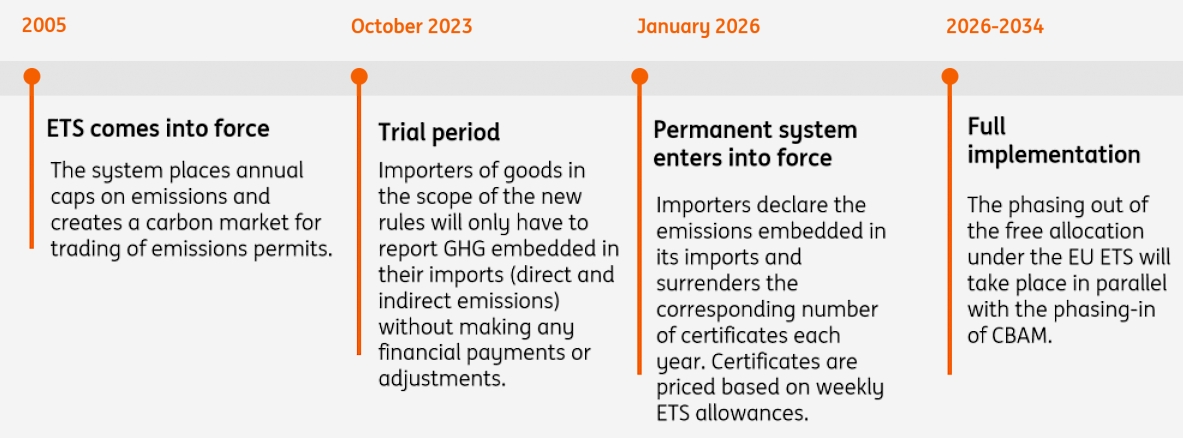
The ETS has been in place since 2005 and works on a cap-and-trade principle. A cap is placed on the amount of emissions that can be emitted by operators who fall under the ETS, and this cap is reduced over time. These operators either buy or receive allowances and can trade the allowances with each other. The price of carbon allowances on the ETS has seen significant strength in recent years following regulatory changes to the system (the market was trading sub-Euro 10/mT in early 2018 but has traded as high as Euro 100/mT in 2023). The EU ETS covers 40% of the bloc’s emissions.
Under the latest CBAM agreement – the first of its kind globally – goods imported into the EU will also face a levy at the border based on their emissions footprint. This will be phased in from 2026 until 2034.
While it may appear that CBAM is aimed at driving decarbonisation among key trade partners, it is in fact a tool to make the EU's ETS more robust and effective. The European Commission currently provides free allowances under the ETS to industries where there is a high risk of carbon leakage. Carbon leakage is where carbon-intensive production is moved to countries where there are less stringent climate policies in place, therefore resulting in no reduction in emissions. In fact, the risk is for higher emissions.
The Commission wants to start reducing the amount of free allowances given to these industries in order to push them to decarbonize. However, in order to mitigate the risk of carbon leakage when doing so, the EU will charge a carbon tax on imports based on their carbon footprint.
CBAM would initially apply to imports whose production is carbon intensive and at the most significant risk of carbon leakage, including cement, iron and steel, aluminium, fertilisers, electricity and hydrogen. CBAM is mostly limited to basic materials and their key intermediates with the broadest value chain coverage in the steel sector, covering both raw materials and downstream fabricated products.
The European Commission estimates that CBAM will help reduce CO2 emissions in the sectors it covers by 1% in the EU and 0.4% in the rest of the world by 2030. It also predicts that the CBAM will decrease carbon leakage in the five sectors by 29% by 2030.
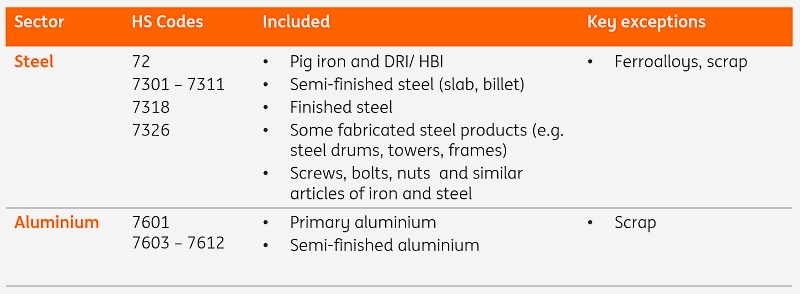
Products covered under CBAM for the steel and aluminium sectors
EU CBAM timeline
How will it work?
The CBAM will initially apply to six carbon-intensive industries: cement, iron and steel, aluminium, fertilisers, electricity and hydrogen. These are the industries where there is a larger risk of carbon leakage. Eventually, the aim is for all imports to be covered by the carbon tax.
For the selected industries, a trial period will begin in October 2023. During the trial period, importers of goods will only have to report greenhouse gas emissions (GHG) embedded in their imports (direct and indirect emissions), without making any financial payments or adjustments. Although according to the draft regulation, indirect emissions will not be calculated for iron and steel, aluminium and hydrogen. However, over time it is safe to assume indirect emissions will also be included for these sectors.
Direct emissions are those emissions created during the production process over which the producer has direct control. Indirect emissions refer to emissions from generating electricity that is consumed in a production process.
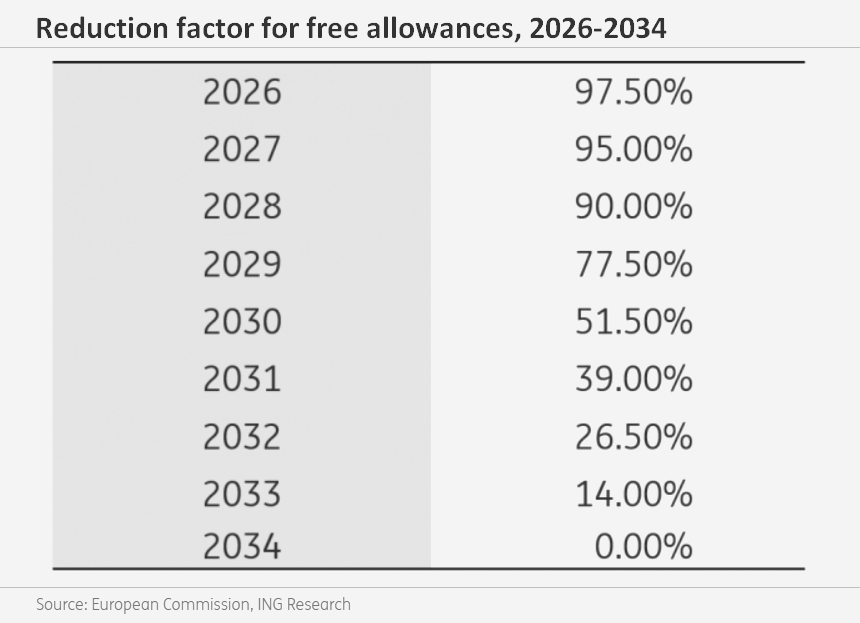
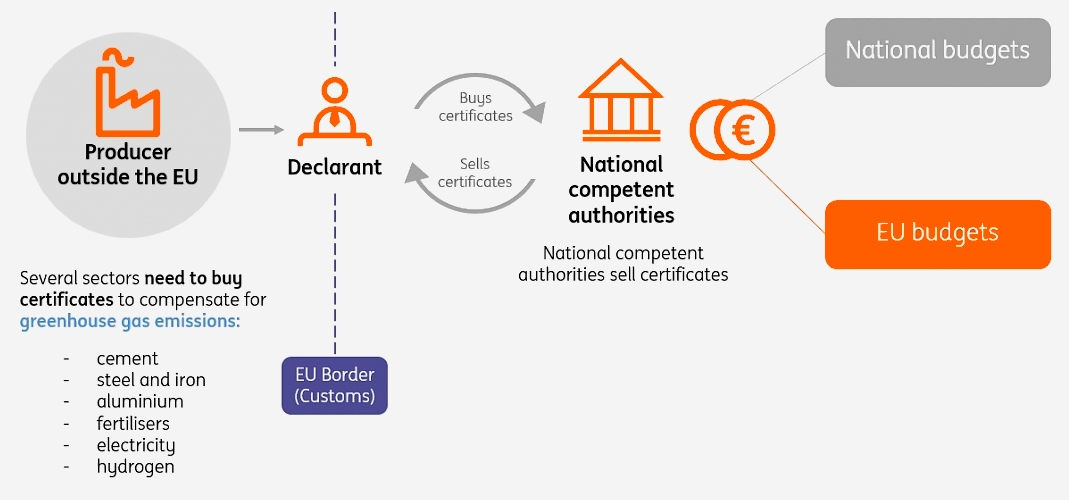
CBAM will come into force from 1 January 2026 and importers will need to declare each year the quantity of goods imported into the EU in the preceding year and their embedded GHG. They will then surrender the corresponding number of CBAM certificates. The price of the certificates will be calculated depending on the weekly average auction price of EU ETS allowances expressed in EUR per tonne of CO2 emitted. The phasing-out of free allocation under the EU ETS will take place in parallel with the phasing-in of CBAM in the period 2026-34.
Some suppliers may be unable to provide the necessary emissions data to EU importers, and at the standard required by the EU. In these instances, default emission data will be used, which could very well be more punitive. This is obviously a risk to some countries/suppliers who simply do not have this level of data.
CBAM will not apply to Iceland, Liechtenstein, Norway and Switzerland given they already participate in the EU ETS or their domestic ETS is linked to it, as is the case for Switzerland. Additionally, goods imported from countries that have a carbon price can offset the amount paid under CBAM by an amount equivalent to their domestic carbon price.
Reduction factor for free allowances, 2026-34
EU CBAM process
How have trade partners reacted to CBAM?
Although CBAM will not be implemented for several years, its proposal has already sparked a backlash from a number of the EU’s trading partners criticizing the bloc of green protectionism. The United States, China, India, Brazil, South Africa and several others have expressed concerns that the new rules will further complicate trade and raise export costs for non-EU manufacturers.
There is a possibility that the EU’s trading partners might choose to retaliate and impose barriers on EU imports in response. They could also challenge the EU’s policy at the World Trade Organisation (WTO). China has already asked the EU to justify its incoming carbon border tax at the WTO, a move that suggests it may challenge the law at the trade courts. China’s Ministry of Commerce released a paper last month saying the government and enterprises should plan how to respond to the incoming changes as early as possible.
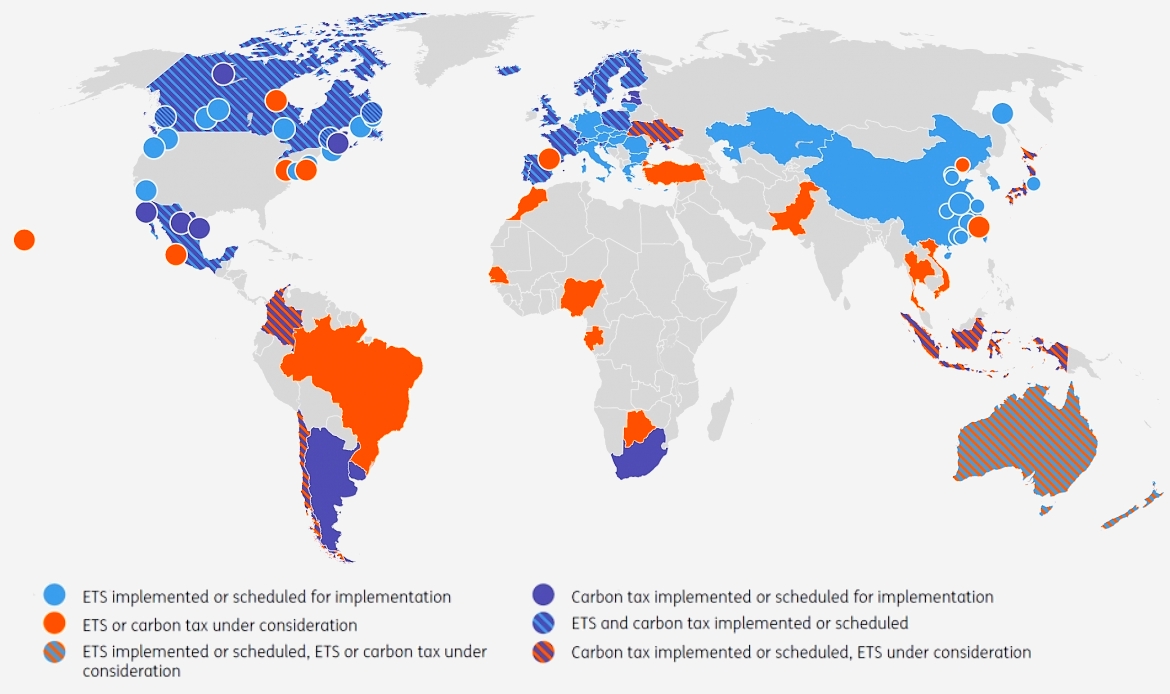
The pushback from a number of key trading partners comes despite a number of these countries having a carbon tax of their own in some form or the other. Some 40 countries and more than 20 cities, states and provinces around the world already use carbon pricing mechanisms, with more planning to implement them in the future, according to the World Bank. In aggregate, these carbon pricing schemes now in place cover about half their emissions, which translates to about 13% of annual global GHG.
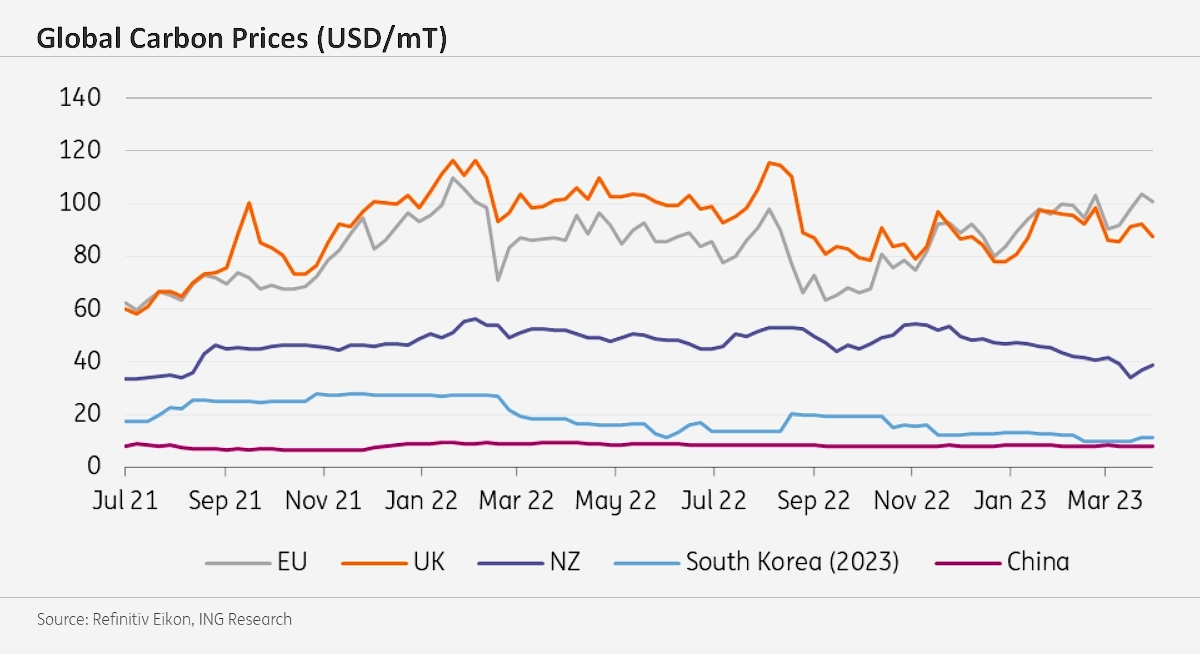
The issue is that the bulk of these carbon mechanisms around the world falls short of the EU’s ETS. This is either in terms of coverage and/or simply the level at which carbon is priced. EU carbon allowances trade at a significant premium to most carbon prices around the world. For example, China’s ETS, which covers only power generators for now, is trading at around USD 8/mT versus the EU market trading in the region of USD 100/mT. The difference will need to be made up for imports into the EU. The only country which has a comparable carbon price to the EU is the UK. In fact, over 2022, the UK ETS traded at a premium to the EU. However, for now, goods imported from the UK will still be subject to CBAM. Although clearly it would make sense to link these, as seen with Switzerland. The UK government has launched a consultation on whether to introduce a UK CBAM as part of its net zero strategy while discussions are also taking place with the EU on whether to link the bloc’s carbon pricing systems to the UK’s.
Ideally, there should be a standard carbon price across the world, yet carbon pricing schemes vary hugely in their severity and scope. A harmonization in carbon taxes globally is much easier said than done.
Carbon pricing initiatives around the world
Global carbon prices (USD/mT)
The impact of CBAM
The first and most obvious impact of the implementation of CBAM is that European consumers will face higher prices. This is not only because imports will be more expensive, but also because the allocation of free allowances to a number of these domestic sectors will be gradually reduced as the CBAM is phased in, which will drive costs higher for EU producers. However, given the phase-out period for free allowances will run from 2026 to 2034, the impact will be felt gradually. Reporting obligations related to CBAM will also push up costs, which will likely also be passed on to consumers.
Carbon leakage is still a risk with CBAM. How much of a risk will really depend on how far downstream CBAM will apply. The draft regulation has tried to address this. So, for example, CBAM will go relatively far down in the steel value chain, covering even screws, bolts and nuts.
Trade flows will also likely be affected. This will be felt both with imports and exports. For exports, the eventual removal of free allowances will have an impact on the export competitiveness of European downstream sectors. A way to minimize this would be to offer a rebate equivalent to the carbon price on export volumes, which would remove the disadvantage for European exporters. However, this is unlikely, given it wouldn’t exactly fit in with the EU’s decarbonisation goals.
For imports, there will also be large shifts. Although the degree of impact will really depend on how carbon-intensive some of these third-country producers are and whether these countries have a meaningful carbon price already in place to drive the decarbonisation of domestic industries in the coming years. Suppliers who have a carbon intensity similar to that of EU suppliers will likely not be significantly impacted in terms of competitiveness. Low-emission producers are likely to increase their share of exports to the EU, given the lower CBAM burden they would face, whilst higher carbon emitters will likely look for markets where their high emission intensity will not be penalized.
What does CBAM mean for aluminium flows?
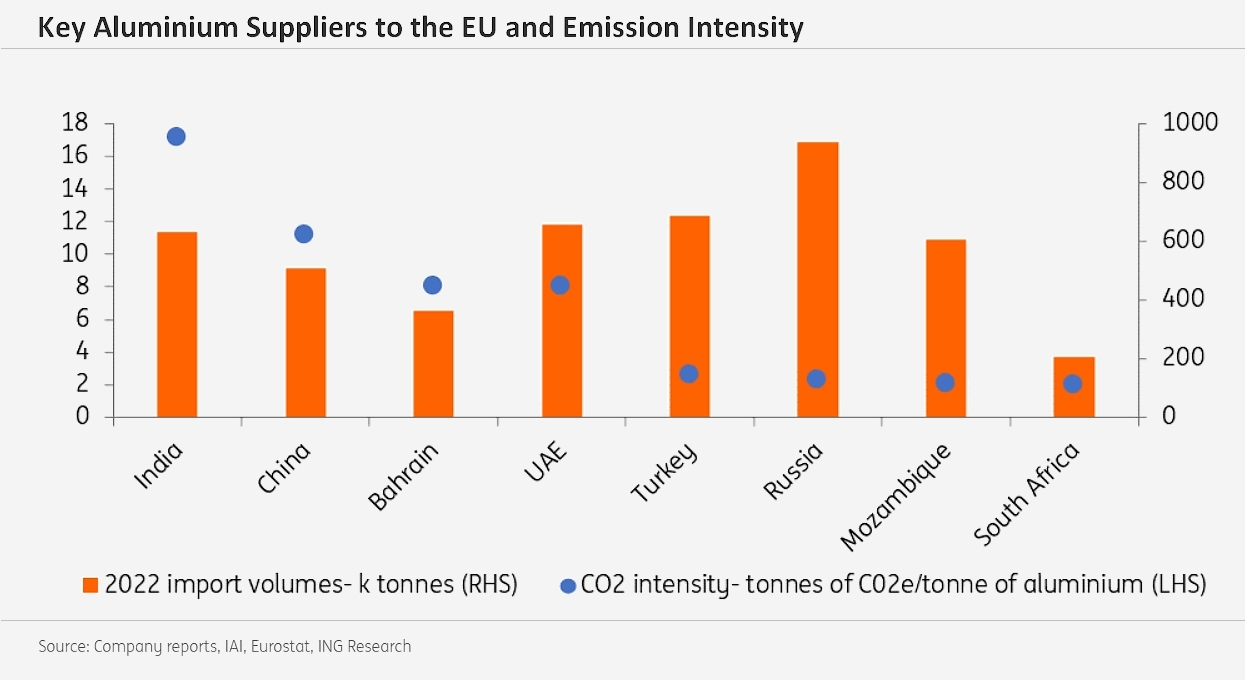
For aluminium, Norway and Iceland were the largest and third-largest suppliers of aluminium to the EU in 2022. Goods from these countries will not be subject to CBAM and aluminium flows are likely to remain largely unaffected. However, other key suppliers include Russia, Turkey, China, the UAE and India. Of these five suppliers, India and China have the highest emission intensity by some distance.
What really drives differences between direct emissions from aluminium smelters is whether they source their power from the grid or have a captive power plant. For those with captive power, their direct emissions are significantly larger. The feedstock used in captive power will also be important. The carbon footprint of aluminium imports mostly comes from the electricity used in the electro-intensive smelting process. Currently, the primary fuel for many captive power plants is coal. In China, for example, 88% of Chinese primary aluminium production is based on coal-fired electricity generation, while the remaining 12% is based on hydropower.
China has its own domestic ETS market, but it only covers power generators for now covering around four billion tonnes of CO2 and trades at a significant discount to the EU ETS. Therefore, the additional cost to move this product to the EU will be significant. As things stand, it would be difficult not to see Chinese aluminium flows to the EU falling. The import cost of Chinese aluminium products into the EU could increase by around 17% as a result of CBAM. However, we will need to see how China’s ETS develops, as over time one would expect prices to strengthen and to also include heavy industry, which would help decarbonise the Chinese aluminium industry, and as a result reduce the CBAM burden. In addition, a trend which has become very clear in China is the moving of smelters to the Southern provinces, and with this, a move away from captive coal-fired power to hydropower, as Beijing has set a goal of achieving carbon neutrality by 2060. By 2027, 29% of China’s aluminium output will be powered by green energy. If this trend continues, it will bring down the average carbon intensity for Chinese aluminium producers, increasing their competitiveness in the EU under CBAM.
The outlook for Indian flows is a bit more worrisome. India does not have a carbon tax or ETS, although there is a coal tax. However, this by definition is not a carbon tax, so it is unlikely to be used as a partial offset for the CBAM. Emission intensity from Indian aluminium producers is not only the highest among suppliers to the EU, but the highest globally. These high emissions are driven by coal captive power plants. The additional cost per tonne of Indian aluminium going into the EU will be significant, and without robust decarbonisation efforts it is difficult not to see these flows being impacted. The import cost of Indian aluminium products into the EU could increase by more than 40% due to CBAM.
Russian aluminium has a relatively low carbon footprint, despite Russia not having a carbon tax. Therefore, CBAM is likely to have a limited impact on these flows. We estimate an additional cost in the region of 6%. The bigger risk to Russian aluminium flows to the EU is the self-sanctioning that we are seeing as a result of Russia’s invasion of Ukraine.
As for Turkey, emission intensity is not much higher than the EU. In addition, it appears as though Turkey is moving toward implementing its own ETS, which if effective would drive further decarbonisation of the industry. Turkey has only one smelter in the country, however, it has a large semi-fabricated and finished products manufacturing base, which imports largely primary aluminium and exports semi and finished products.
The UAE is also a fairly large supplier to the EU, and like China and India, the smelters in the country use captive power. However, instead of using coal, natural gas is the feedstock. This does mean emission intensity is significantly lower than in India and China. However, given the use of captive power, direct emissions are still higher than those seen in the EU – although the UAE is starting to increase the use of renewable power in its aluminium industry.
Key aluminium suppliers to the EU and emission intensity
What does CBAM mean for iron and steel flows?
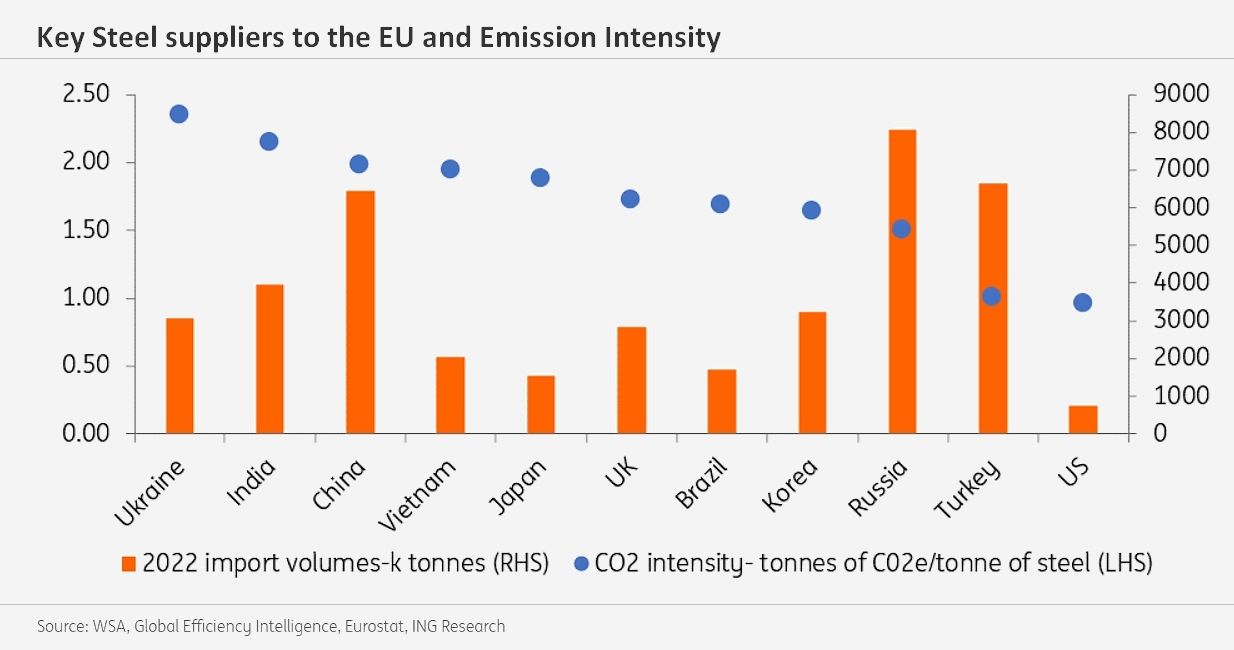
While the iron and steel sector is an overall larger emitter of emissions than the aluminium sector, emission intensity is much lower than that of the aluminium industry, with a global average of 1.91 tonnes CO2e/ per tonne of steel. There are a number of factors which affect this, but the most important comes down to the production process used. Direct emissions from the basic oxygen furnace (BOF) process are significantly higher than that seen from electric arc furnaces (EAF), which use scrap as feedstock. Global emission intensity via the BOF process, which makes up around 71% of global production, averages 2.23 tonnes of CO2 per tonne of crude steel output, whilst emission intensity via the EAF route (29% of global output) averages 0.67.
In the EU, just under 60% of the bloc’s total steel is produced via the BOF process, while around 40% is produced via the EAF production route.
The variance between emission intensity in the steel sector is much narrower than seen in the aluminium industry. This also suggests that trade flows are also likely to be less affected. Looking at the largest suppliers of steel products to the EU, CBAM could increase import costs in the region of 8%. Although obviously, this will depend on where carbon prices are trading.
In 2022, Russia was the largest supplier of steel products to the EU. These flows are predominantly semi-finished steel products, as well as pig iron. Russian steel has an emission intensity in the region of 1.5 tonnes of CO2 per tonne of steel, which is below the global average and suggests that CBAM should not impact flows significantly. However, the bigger impact on Russian steel is the EU’s eighth sanction package against Russia, which includes semi-finished steel products.
Steel flows from the second-largest supplier to the EU – Turkey – should manage with CBAM. Turkey has a large amount of EAF capacity meaning that emission intensity is well below the global average as well as the EU average.
China was the third-largest supplier of steel products to the EU in 2022. The emission intensity of the Chinese steel sector is also the third-highest among the largest suppliers to the EU. As previously mentioned, China has launched a domestic ETS, which will eventually cover the steel sector, and assuming an effective ETS price, should help to decarbonise the domestic industry. The government in recent years has already taken steps to try to decarbonise the sector. And with China’s scrap ratio still well below the global average, there is the potential to increase this further in the years ahead, which would drive emission intensity lower.
Indian steel has the second-highest emission intensity amongst the largest suppliers of steel products to the EU, with only Ukraine ahead of it. With an intensity above both the global average and the EU average, we could very well see these Indian steel flows coming under pressure. There are some Indian domestic producers which have targets to cut emission intensity to levels more comparable to the current global average by the end of this decade.
It is not just steel and downstream steel products that will be subject to CBAM. Upstream sectors will also be affected with iron ore falling under CBAM. However, the emission intensity of iron ore is marginal and so this should have little impact on flows. In addition, the EU is highly dependent on iron ore imports, further supporting the idea of minimal impact on trade flows.
Key steel suppliers to the EU and emission intensity
Under the provisional agreement, CBAM will begin to operate from October 2023 in its transitional phase.
Sources: think.ing.com, seekingalpha.com