Trade is increasing slightly, but the overall contribution of the largest ten processing countries has decreased
Based on current forecasts compiled by the WPTC (situation as of 30 April, see related articles), the world's production of tomatoes for processing during the 2021 season is expected to be around 39.1 million metric tonnes (mT). Processing intentions in the northern hemisphere amount to 34.8 million mT and this year represent 89% of overall operational prospects. The countries of the southern hemisphere are expected to process around 4.3 million mT, or 11% of the quantities currently forecast.
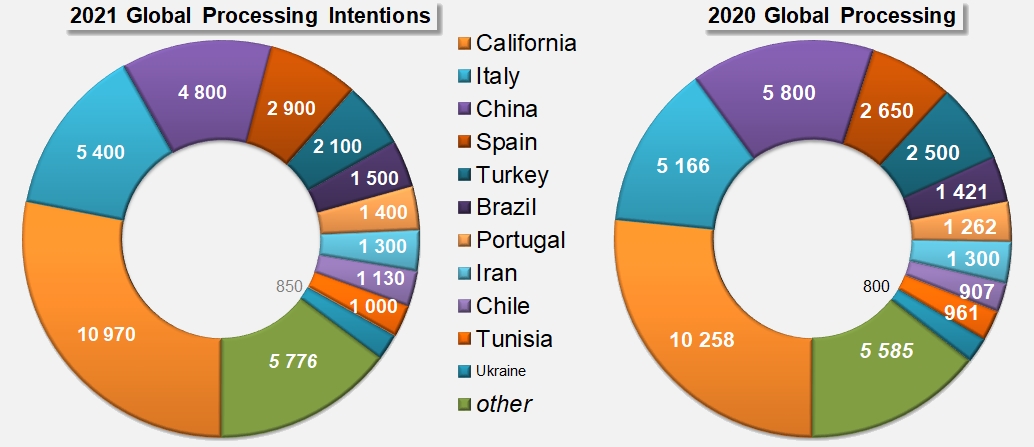
The quantities programmed this year by the ten largest processing countries amount to 32.5 million mT (val. 30 April 2021), a target that is up 275,000 mT (0.9%) compared to the result for 2020 (32.225 million mT) and 1.725 million mT (5.6%) higher than the average result recorded over the last three processing seasons (30.775 million mT).
For this same 2021 season, the volumes programmed by the forty other countries in the WPTC study amount to just over 6.6 million mT, an increase of 241,000 mT (+3.8%) compared to last year, comparatively much more significant than that of the Top10 countries. A similar observation can be made with regard to a comparison of operations during recent years, since 2021 objectives in “other countries” indicate an increase of more than 7.5% (465,000 mT) compared to the average level for the period running 2018-2020.
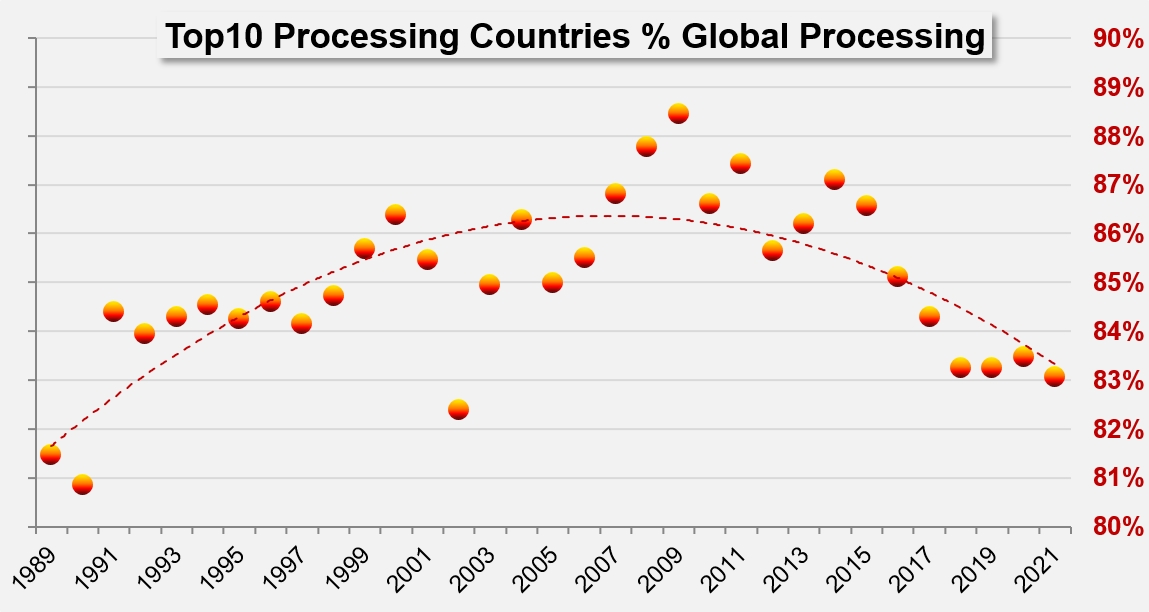
More broadly, it appears that after the historic highs reached in 2009, the quantities processed on a global scale have declined significantly, to the point that global processing forecasts are still 12% lower in 2021 than the excessive results of 2009.
During this twelve-year period, however, the “Top10” and “other countries” components of global processing have evolved in very different, if not contrary, ways. Total results of the world's Top10 countries (a list whose composition did not change much over the period) decreased significantly, leaving the 2021 targets at nearly 7 million mT below the peak of 2009. At the same time, operations in “other countries” developed at a faster pace, sometimes driven by a search for self-sufficiency, often also in order to build or consolidate profitable export trade. Over the course of these twelve seasons, the quantities involved increased by nearly 1.5 million mT, which amounts to a progression of around 29%.
The combination of all these dynamics has resulted in an slight drop in the relative proportion that can be attributed to the Top10 countries, which accounted for as much as 89% of total global operations in 2009 but are expected to account for just over 83% in 2021. Proportionally, this is one of the lowest levels of the last thirty years.
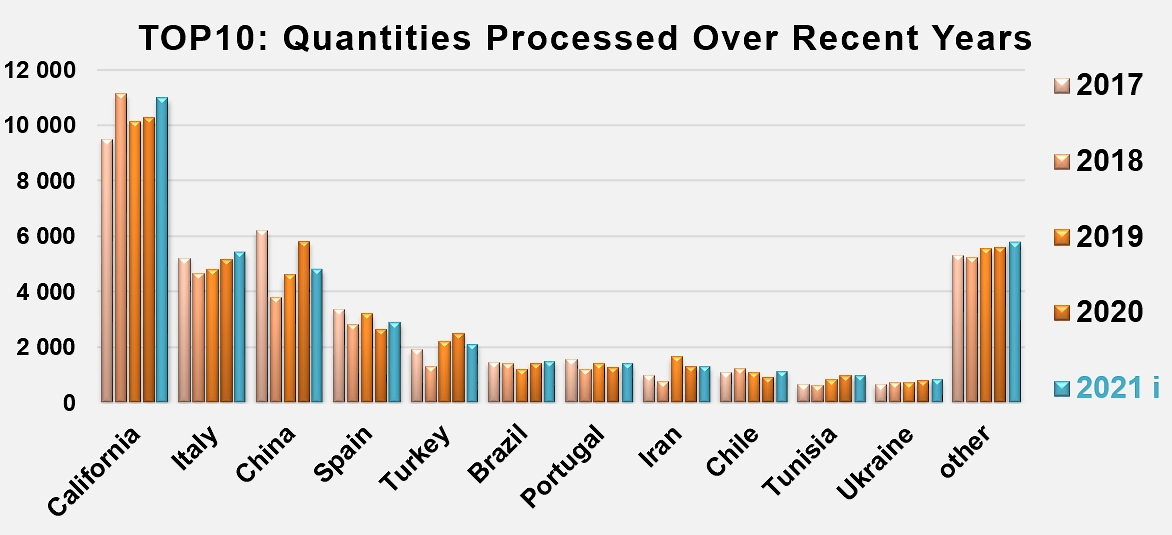
In a general context of growth in worldwide activity, the quantities processed by the industries of the Top10 countries seem to be growing more slowly than those of the forty or so other countries active in this sector. It is to be hoped that by reining in quantities in this way, the sector can prevent the risk of getting carried away with production, a situation that always threatens the business of the worldwide processing sector in its periods of optimism or euphoria.
Additional information:
Comparison of 2020 production and 2021 current forecast for the TOP10 countries
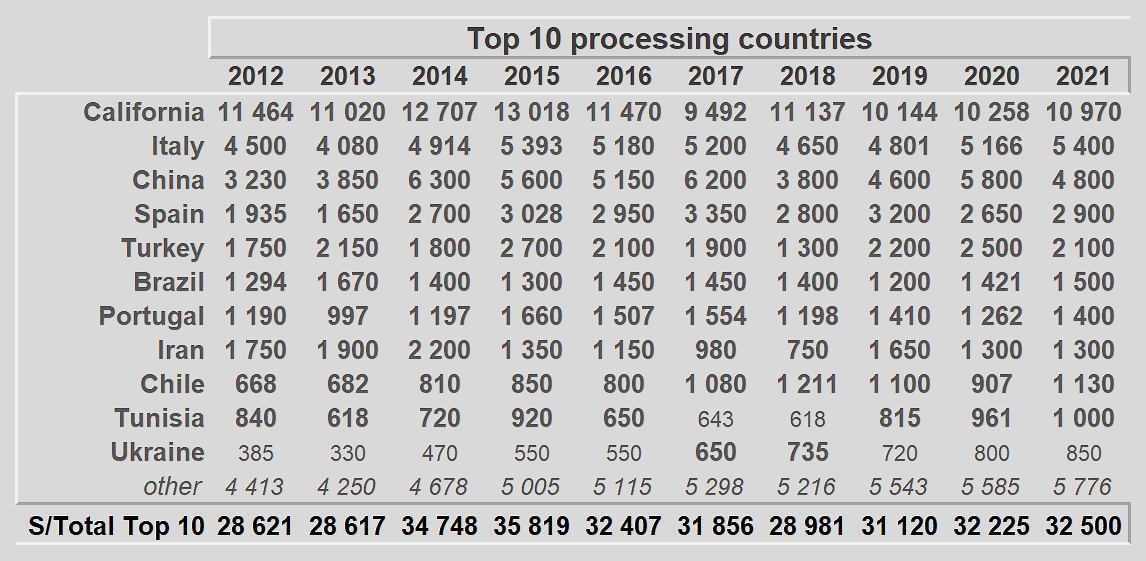
Quantities processed by the countries appearing in the TOP10 list over the period running 2012-2021
Sources: WPTC, Trade Data Monitor