Worldwide trade absorbed less raw materials in 2016
At the risk of stating the obvious, the slowdown in the growth rate of consumption has once again been confirmed by 2016 results for global trade. The volumes shipped around the world dropped slightly last year, leading to a tighter situation for outlets and adding to the tensions observed in terms of competition between the main processing countries attempting to market their processed products. This further contraction complicates the strategy of companies who can no longer count on constantly positive and regular growth in the worldwide markets to provide the impetus for their business. This is likely to lead to an increase in the intensity of competition, particularly in areas where the market is still growing.
In 2016, accumulated volumes of tomato products exported at the worldwide level amounted to the equivalent of slightly more than 25.25 million metric tonnes (mT) of raw materials – approximately 66% of the volumes processed during the year, but more importantly, 0.7% (175 000 mT farm weight equivalent) less than in 2015. Whether it is a technical adjustment or an effect of carryover stocks, this variation is not sufficiently significant to be interpreted as a slowdown in operations, all the more so for the fact that these volumes indicate a 2% progression compared to the average of the three previous years (2013-2015). Yet this result is part of a wider set of dynamics that indicates a slower growth rate for worldwide consumption in recent years, as we have already stated.
It is a fact that the volumes traded each year increased at an average rate of 6.5% until 2011, climbing over fourteen years from less than 10 million mT to close on 24 million mT. Six years ago, this relatively dynamic period gave way to a new phase in worldwide trade, featuring a much slower annual growth rate of about 1.2% per year. Altogether, this shift in dynamics and the effects of the excessive production of 2009 can be considered as one of the causes of the difficulties faced by the industry over the past eight years, a period during which it has never completely and definitively recovered from a situation of crisis.
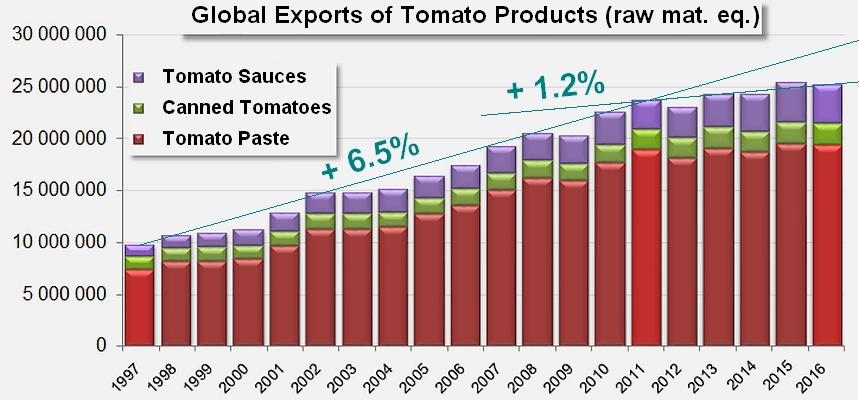
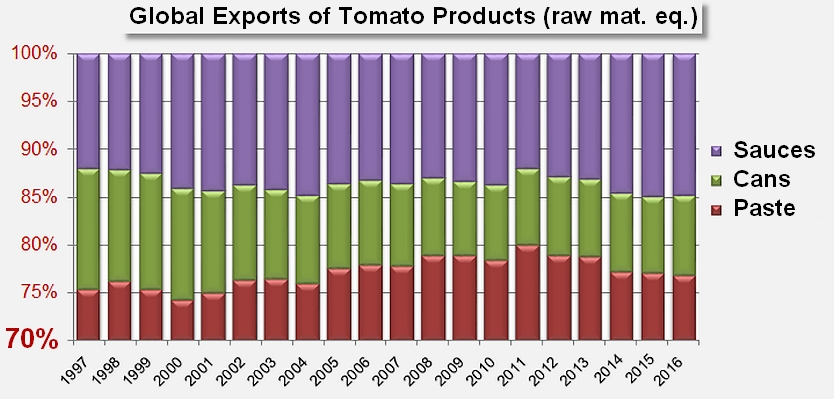
2016 results also confirm another global trend, whereby the trade in the more elaborate products (ketchup, sauces, etc.) has built up an increasing importance compared to the two other categories, specifically at the expense of canned tomato sales. Without being spectacular, the growth of the ketchup & sauces category is undeniable, taking this family of products to approximately 15% of worldwide trade over the past three years, against approximately 12% at the end of the 90s. The canned tomato sector, which accounted for 12% of worldwide trade twenty years ago (expressed in farm weight equivalent), only accounted for slightly more than 8% of volumes in recent years (see the infographics presented at the end of this article).
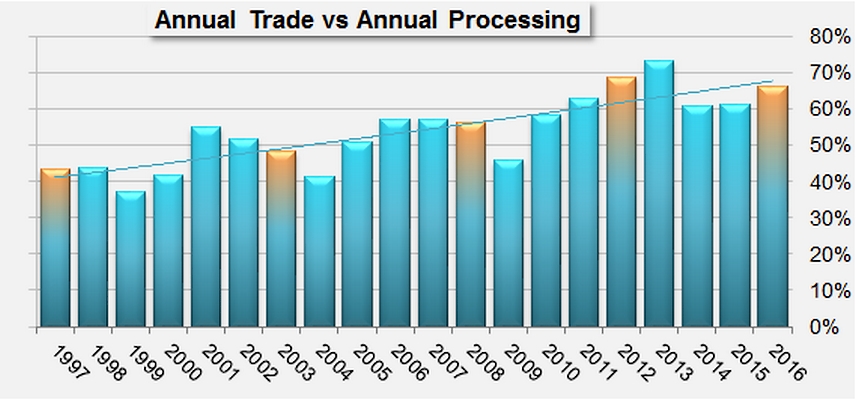
Finally, 2016 confirmed the increasing dependence of outlet countries on supplier countries and the growing importance of developing export activities for the world's main tomato processing industries. Independently from the mechanical effects linked to the drop in processed volumes last year, 2016 can clearly be seen as a continuation of the dynamics recorded in previous years, with a constantly growing proportion of processed volumes being absorbed by export operations. Last year, more than two thirds of the tonnage – 25.2 million mT in farm weight equivalent out of the 38 million mT processed – were absorbed by international shipments overall. In 2012, the worldwide trade in tomato products absorbed 69% of the processed volumes, accounting for only 57% five years before that, 52% in 2002 and a mere 44% of worldwide activity in 1997.
Paste: regional dynamics are highly contrasted
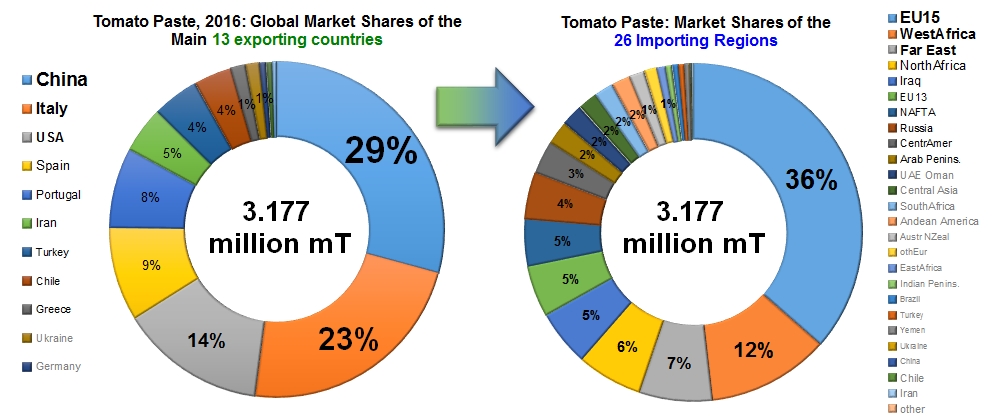
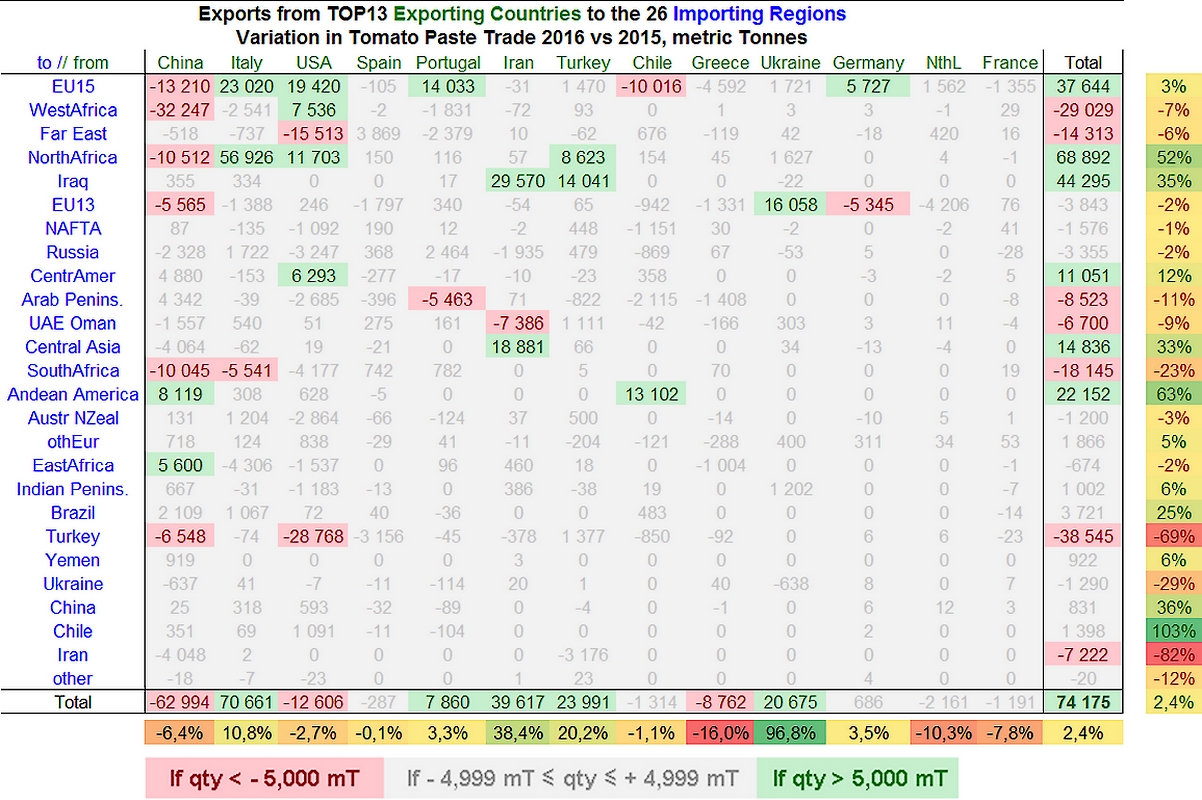
The virtual stability of the volumes traded around the world actually hides a wide diversity of regional dynamics, which seemed to be more marked in 2016 than they were previously. The overall annual result – approximately 3.3 million tonnes of finished products – only increased by slightly more than 93 000 mT (3%) compared to 2015, but this modest progression hides some wide variations for a number of markets. Paste purchases by countries of West Africa, the Far East, the Arab Peninsula, southern Africa and Turkey – to only mention the main ones – recorded notable decreases in 2016. In the cases of the Arab Peninsula (-11%) and Turkey (-69%), these drops occurred after sharp increases in 2015, so they can be considered as mere operational adjustments. However, in the cases of the Far East, Russia, Iran, southern Africa and West Africa, these decreases confirm a contraction of operations that is part of a wider set of dynamics, which could become a concern for their main supplier regions.
Altogether, these decreases, which also involve a number of other regions, amount to more than 134 000 mT of finished products. Fortunately, these drops were compensated by developments that altogether amounted to almost 209 000 mT of products last year. The most noticeable of these (in excess of 5 000 mT) include the volumes shipped to Mediterranean Africa (+52%), Iraq (+35%), the European Union (more specifically the EU15, +3%), as well as countries of Andean America (+63%), Central Asia (+33%) and Central America (+12%).
As announced in our previous commentaries (see our article in the February 2017 issue), the Chinese industry came in last this past season, having dropped more than 6% and close on 63 000 mT compared to its export results for 2015. Despite a very aggressive commercial policy, and due to its much greater vulnerability because of the worldwide reach of its export activity, China bore the brunt in 2016 of the decreases recorded for West Africa (one of its most favored outlets, with Ghana, Nigeria, Cameroon, Gambia), for southern Africa (Congo, Angola), for Turkey, for Iran... More worrying, important drops have also impacted the flow of Chinese paste to countries of the EU15 (Italy, France, UK) and Mediterranean Africa (Algeria). However, Chinese products have been able to benefit from the development of purchases recorded in Andean America (Argentina), and have been the only ones to record a significant increase in East Africa (Sudan).
US processors are less vulnerable than their Chinese counterparts, but have nonetheless been facing commercial difficulties since 2014/2015. They did however manage to limit, to an extent, the impact of the stronger US dollar on foreign sales and to contain the erosion of their outlets. US exports, mainly Californian, shrunk 3% (-12 600 mT) compared to 2015 results. The strong reduction of Turkish purchases can largely account for this, along with decreases recorded for sales to countries of the Far East (South Korea, Japan and the Philippines). Conversely, US performances recorded a sharp improvement for a restricted number of European destinations (Italy, +51 000 mT), Mediterranean Africa (Morocco, Israel), West Africa (Ghana, Ivory Coast), and Central America (Columbia, Panama).
Although recorded results for 2016 in Greece were slightly lower than previous years, the country's exports (46 000 mT) confirmed the slowdown in foreign business observed over the past ten years, possibly as far back as the beginning of the 2000s. Although this drop is minimal (approximately 8 800 mT of products), it actually weighs quite heavily (-16%) on volumes that in any case only amounted to approximately 55 000 mT in 2015. Unlike the situation of Chinese or American operators, this drop can be attributed to a generalized slowdown rather than to failures linked to circumstances in particular regions. As it turns out, it is on the European market (EU28) that the Greek industry lost most ground last year (-5 900 mT of products), as well as on the markets of Saudi Arabia and Sudan.
Unlike industries whose export operations may have been penalized by links to the US dollar, several major players of the international processing tomato sector ended 2016 with particularly positive results sheets. All of them did not evaluate their trade in euros, but many of those that did feature in the worldwide TOP13 ranking of paste exporting countries.
The first of these is Italy, whose paste exports underwent a notable recovery after ten years of relative stagnation. Last year, 727 000 mT of Italian paste were shipped abroad, which is 11% more than in 2015 and 10% more than the average of the period covering 2006-2015 (662 000 mT). Even more so than their Californian counterparts, Italian operators were able to benefit from the notable increase in purchases within the EU15 (Germany, UK, France, Belgium) and in Mediterranean Africa (Libya), without being overly affected by the protectionist decisions implemented in West Africa (Nigeria, etc.), nor by the notable slump in Far-Eastern purchases. On the other hand, Italian paste has known limited success in southern Africa, probably due to the weakening of the South African rand (see also our report in the May 2017 issue of Tomato News).
As for the Spanish industry, which has increasingly affirmed itself as a direct challenger to the Italian industry within Europe, 2016 can be considered as a kind of "blank year". Within a few dozen tonnes, the latest result (287 900 mT of finished products) almost exactly repeats the result of 2015 (288 200 mT). The biggest variations did not exceed 4 000 mT and were recorded for Japanese sales (up by 3 700 mT) and Turkish sales (down by 3 200 mT).
At the European level, Spanish companies were not able to benefit from the recovery of purchases (+33 600 mT) to the same extent as their competitors in Italy, California and Portugal, nor were they able to fill the positions left vacant by Chinese or Chilean competitors. Exports only progressed in a limited number of countries (Germany, Sweden and, to a lesser extent, Italy and Portugal). Results lower than those of the previous year were recorded in the Netherlands, France, the United Kingdom and several other destination countries.
Along with neighboring Spain, as well as Chile, Germany, the Netherlands, etc., Portugal is one of the countries whose performances varied very little between 2015 and 2016. The modest progression (7 800 mT, 3%) – in harmony with the worldwide trend for 2016 – of the fifth biggest worldwide exporter of tomato paste was mainly driven by the growth in European purchases, most noticeably from the Netherlands, France, Belgium and Spain. On the other hand, Portuguese business suffered from sudden adjustments in Saudi imports and, to a lesser extent, from the drop in sales to Senegal and Japan.
2016 will remain, for reasons detailed in our article published last January, a year of major development for the Iranian industry. Export volumes increased in a particularly exceptional fashion (+38%!) compared to results in 2015, driven by the two biggest progressions observed in recent years – from Iraq (+29 600 mT) and Afghanistan (+18 900 mT). Iranian results were impacted however by adjustments carried out in 2016 by the United Arab Emirates, whose purchases sharply increased in 2015, and by Russia, whose purchases have tended to drop over the past three years.
For obvious geographical reasons, Turkey is, along with Iran, the only country to have benefited from notable increases in Iraqi purchases in 2016. This destination as well as a number of North-African trade outlets like Syria and Libya account for most of the 24 000 mT (+20%) increase that Turkish operators achieved compared to 2015 results.
Country-specific and region-specific results are presented in the infographics at the end of this article.
Canned tomatoes: big disparities between markets, majorly disproportionate supplier zones
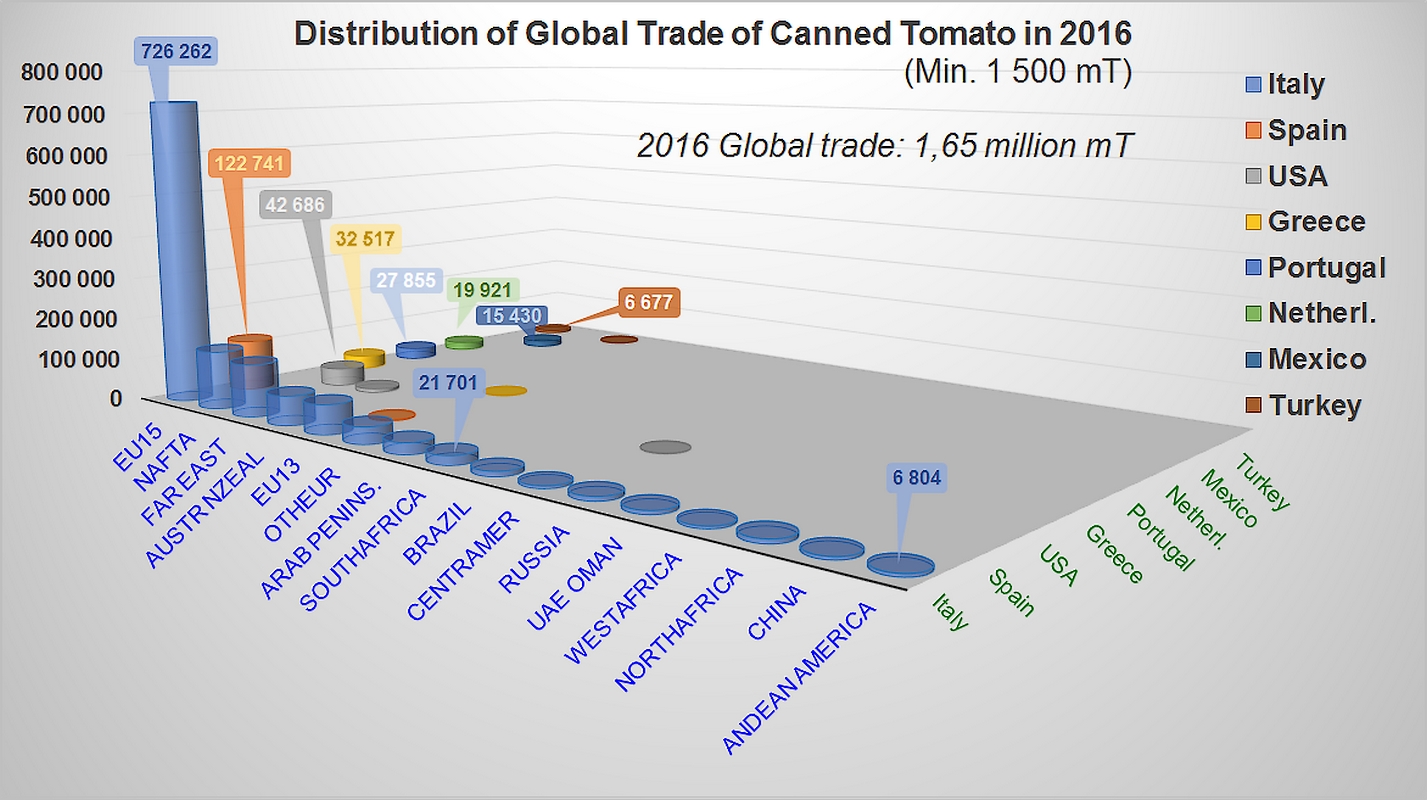
This worldwide export category, which last year mobilized tonnage that was only half the size of our industry's main category, recorded growth from 2015 to 2016 that was slightly more marked than paste. Export volumes (1.65 million mT of finished products) recorded a progression of 65 600 mT (+4%) compared to 2015, right in line with developments recorded over the past two decades.
Three main regions absorbed the largest part – close on 80% – of the volumes shipped in 2016, in a pattern that virtually repeated the dynamics of previous years. The EU alone absorbed more than 1.015 million mT of finished products, which is more than 63% of the quantities exported around the world. The United States and the Far East (mainly Japan) respectively purchased close on 200 000 mT (12%) and close on 138 000 mT (9%) of canned tomatoes last year, ahead of secondary markets like the non-EC countries of Europe and the Asia-Pacific region. This last region (Australia) is, along with Central America (Venezuela), the only region to have recorded a significant decrease in its purchases last year, while the three main regions along with Andean America and Mediterranean Africa increased the volume of their purchases.
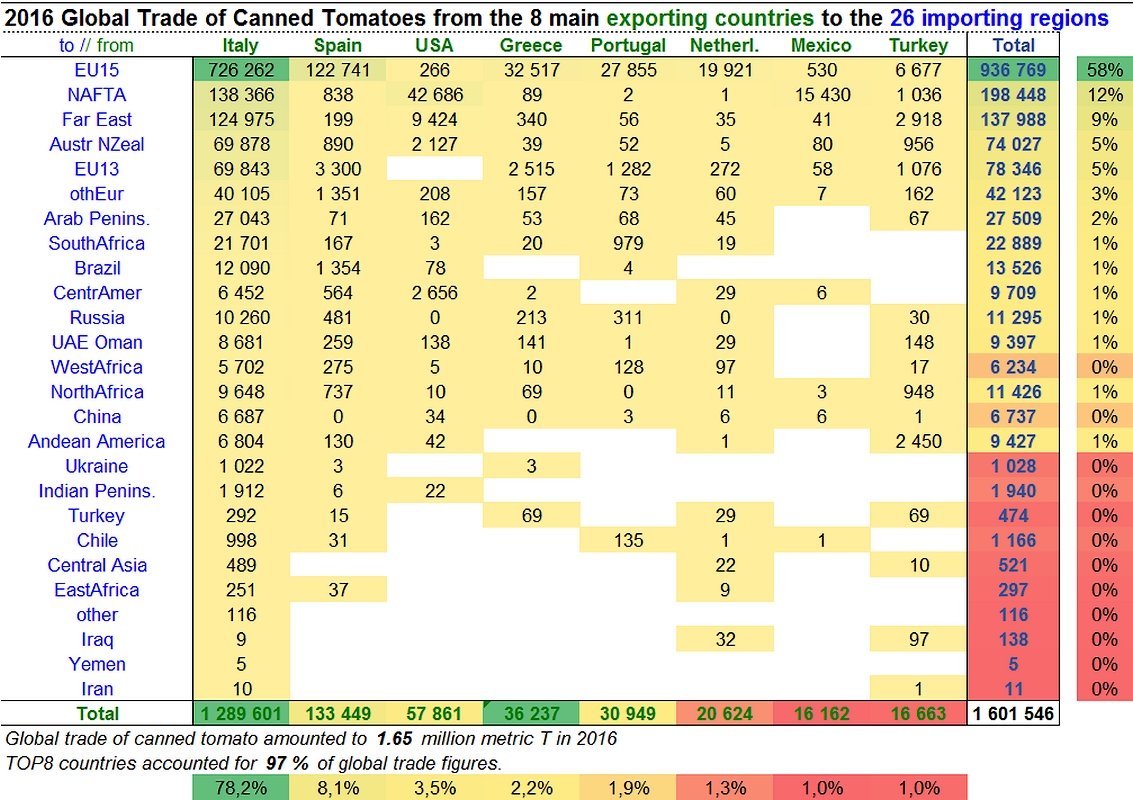
The markets of the EU were once again the central focus of business last year, and except for a few minimal variations in quantities delivered to Japan and the USA, they accounted for most of the increases and decreases that significantly affected operations in the different competing countries. In fact, these markets understandably allowed Italy (undeniably the world's n°1 leader for this sector) to record the best performance of the year, with a 48 000 mT increase in its exports. US operators lost a few market shares in the EU, as did their Spanish counterparts. But EU markets also allowed Portuguese and Dutch foreign sales to record modest but real progressions (+3 100 and +4 700 mT), confirming the growth already recorded in 2015.
The EU accounted for 63% of the total annual variation in the worldwide trade of canned tomatoes in 2016. The same variations in volumes were also a feature of supplier regions, in a context that is almost devoid of competition: the quantities exported by Italy were 10 times higher than the second biggest player in the field, Spain, whose operations were twice as voluminous as those of the United States and almost four times higher than the world's 4th biggest operator, Greece.
Overall, 2016 actually accentuated the polarization of this category: despite the overt efforts of the Spanish industry to develop its foreign business in this sector, 2016 saw a 12 000 mT drop in canned tomato exports from Spain, the second consecutive disappointing result after the decrease of almost 16 000 mT recorded in 2015. This is no doubt one of the effects of the efforts invested by Italian industry leaders to recover control of the worldwide markets rather than a real counter-performance of the Spanish industry. The cause of the Spanish fallback is to be found in the decrease of the volumes shipped notably to France, Sweden, the United Kingdom and... Italy, all of which are destinations where Italian operators recorded particularly satisfying results last year.
Any remaining notable considerations boil down to the effects of variations in the volumes supplied by the different regions on Italian results: the increases recorded for imports to Andean America, the EU, NAFTA countries and Mediterranean Africa, as well as the decreases recorded for Australia and Venezuela, virtually only had an impact on the foreign sales of Italy, which they mirrored fairly closely.
In the final count – at the risk of a fairly simplistic statement – worldwide exports of canned tomatoes increased by 65 560 mT last year, of which 65 540 mT were achieved by the eight leading countries of the category, including 63 190 mT attributable to the Italian industry alone.
Ketchup and tomato sauces: stability and competition
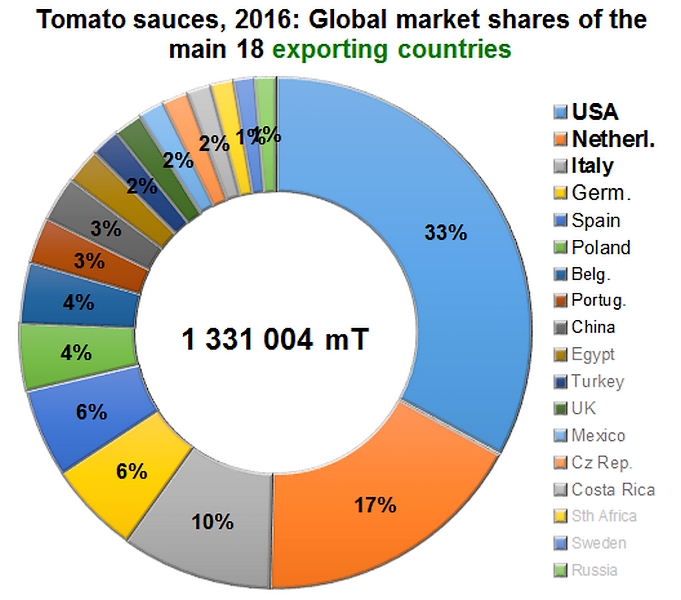
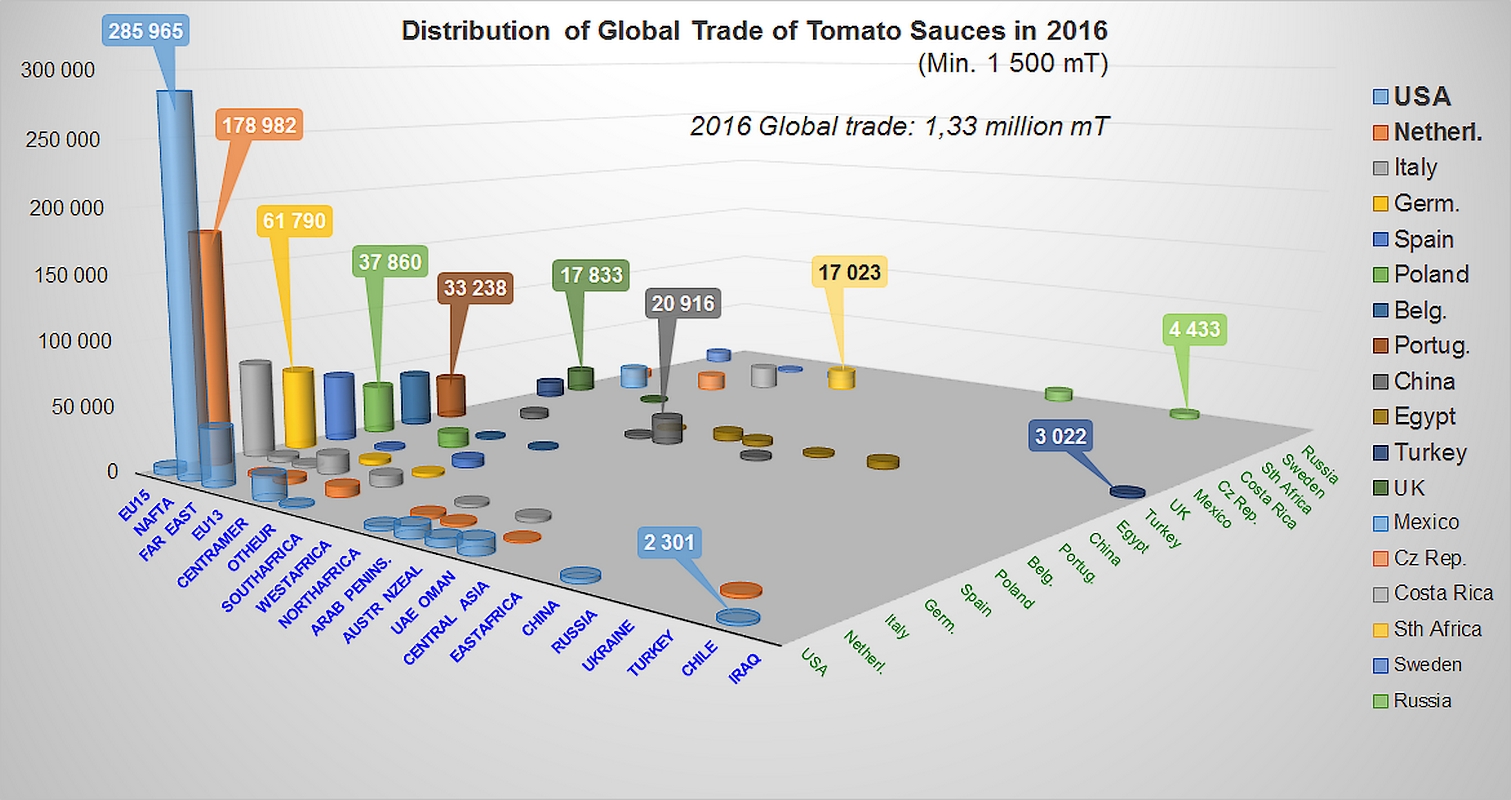
1.33 million tonnes of products: this is the total volume of tomato sauces & ketchup exported around the world in 2016, slightly down (-33 000 mT, -2%) on 2015 results, but sharply up (+5%) compared to the average of the three previous years. The coherence of the progressions recorded in recent years for just about all of the main consumption regions is most likely indicative of a simple adjustment after four years of strong growth rather than of a significant shift in supply habits.
Indeed, an overall investigation of trade patterns reveals very few decisive variations – either positive or negative – over the past two years. In most cases, the volumes supplied increased moderately (less than 1 500 mT), and only four regions (NAFTA, southern Africa, the Emirates and West Africa) recorded more notable growth results (without however exceeding 6 800 mT, even for the best performance). The worldwide sauces & ketchup market is globally stable, with regional product flows that only recorded one single significant variation last year – a drop in supply shipments to the EU15 (-57 600 mT of products) – more specifically involving British imports (-31 900 mT, -19%), Dutch imports -6 200 mT, -14%), German imports (-4 200 mT, -4%), but also imports to Finland, France, Belgium, etc.
 Although most of the decreases recorded in the EU15 can be interpreted as adjustment measures after six years of sustained growth (average annual rate of 3.6%), the drastic drop in the United Kingdom's sauce purchases is in sharp contrast with the variations recorded in neighboring countries. The quantities of sauces & ketchup delivered last year – slightly less than 139 000 mT of products – recorded a 19% drop against 2015 results, but were also 10% lower (approximately 15 500 mT) than the average flow of the three previous years.
It is likely that the slump in the pound against the euro, observed between December 2015 and October 2016 and the general context created by the decision to leave the EU have played a role in the reduction of the supply flow to the United Kingdom. The impact on European companies active on the British market can already be measured, and could be further aggravated in coming years. For the time being, the only industries whose export results for sauces & ketchup were adversely affected in 2016 are in the Netherlands (-30 200 mT), Germany (-2 150 mT), Spain (-4 700 mT) and Poland (-10 700 mT). All of these industries have suffered from the brunt of the British collapse, whereas growth achieved by the tomato industries in the US (10 700 mT), in Italy (4 900 mT), in China (7 200 mT) and in Mexico (3 400 mT) is based on the development of outlets in Mexico, the UAE, Poland, Benin and Ghana, and the USA.
(See also our article on the turnover results recorded by each country's industry in 2016 in the May 2017 issue of Tomato News.)
Some complementary data
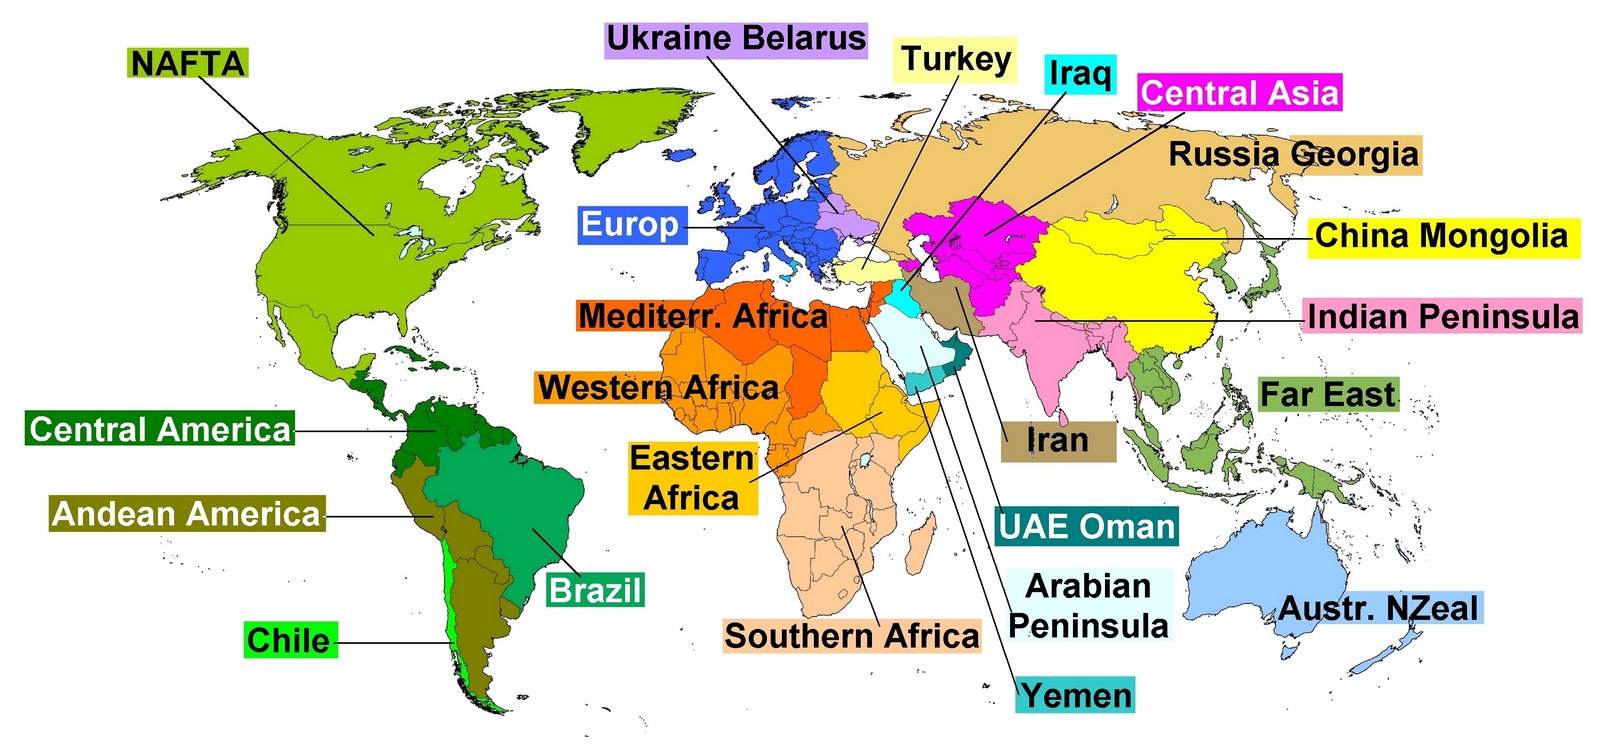
Imputation of quantities traded on total export flows and total import flows, by exporting country and by importing region.
Proportionally to the volumes of raw materials absorbed by exports of industrially processed products, the paste category developed until 2011, at the expense of the other two main categories of processed tomato products. Since then, more elaborate products like sauces & ketchup have progressed noticeably, at the expense of the paste and canned tomato product categories.
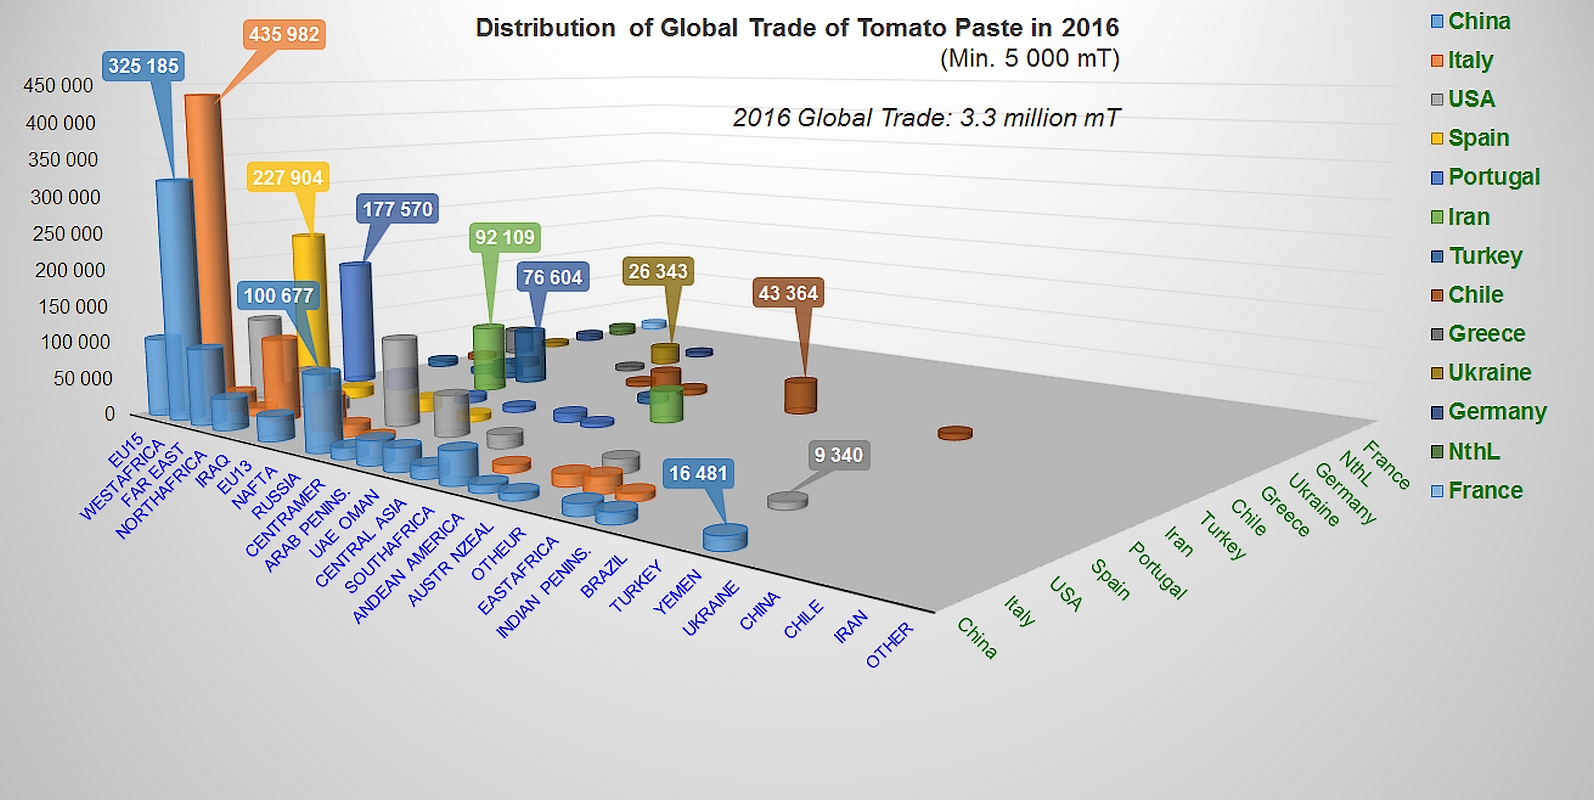
Tomato paste
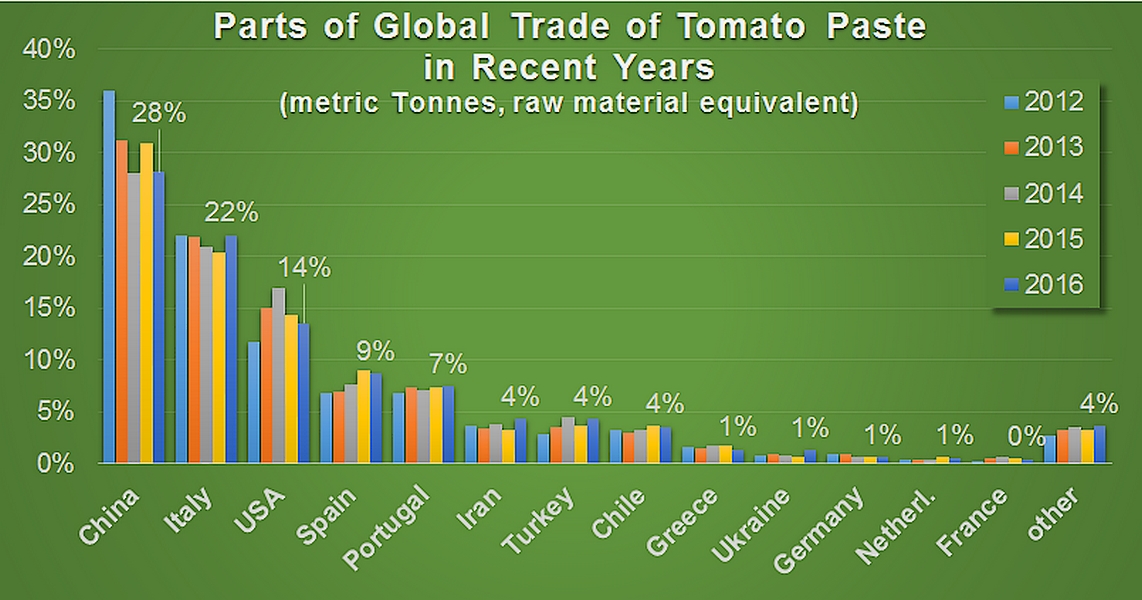
Evolution of the market shares of worldwide tomato paste exchanges for the thirteen main processing industries
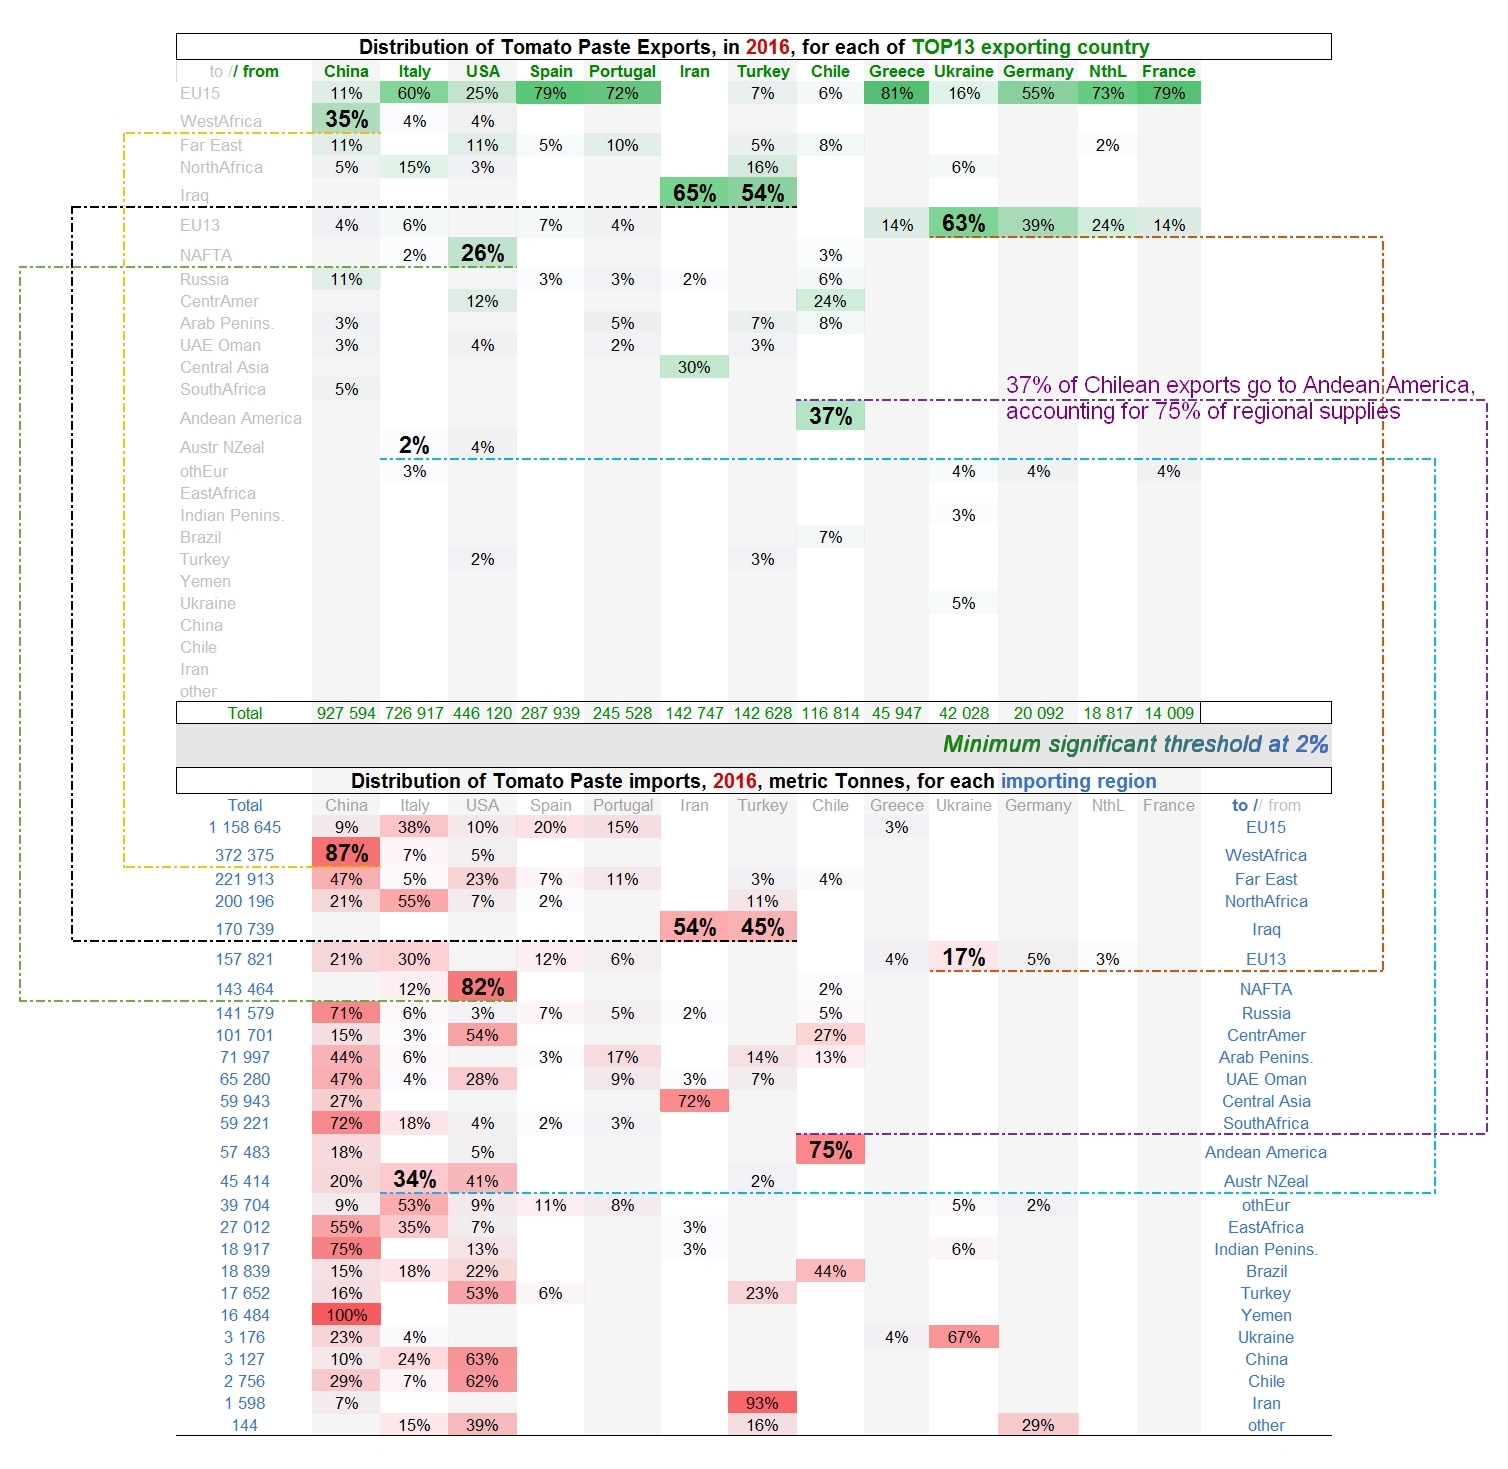
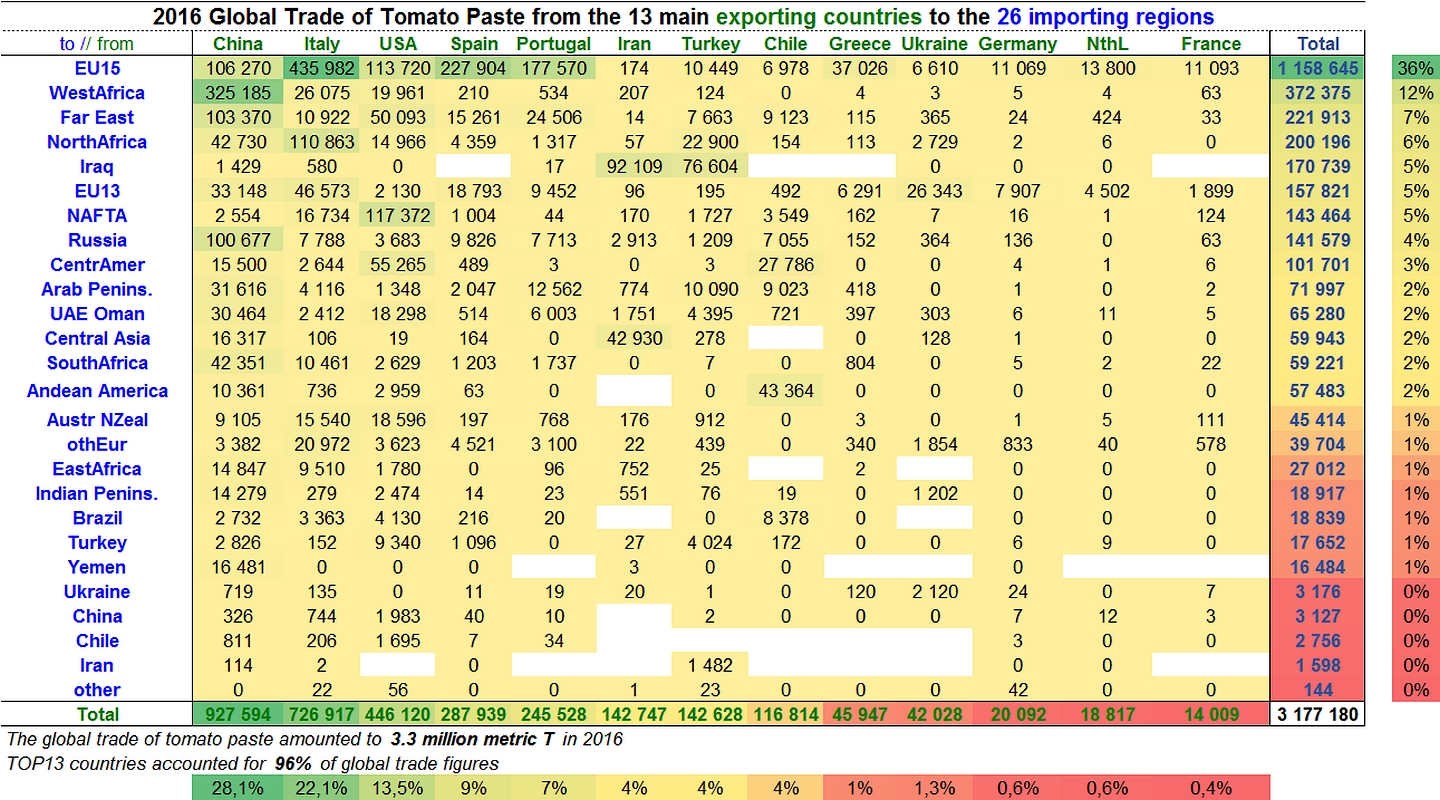
Synthetic presentations of 2016 exports of tomato paste, for the thirteen main processing countries towards the 26 different consumption regions. Stated figures account for more than 96% of worldwide trade for the year.
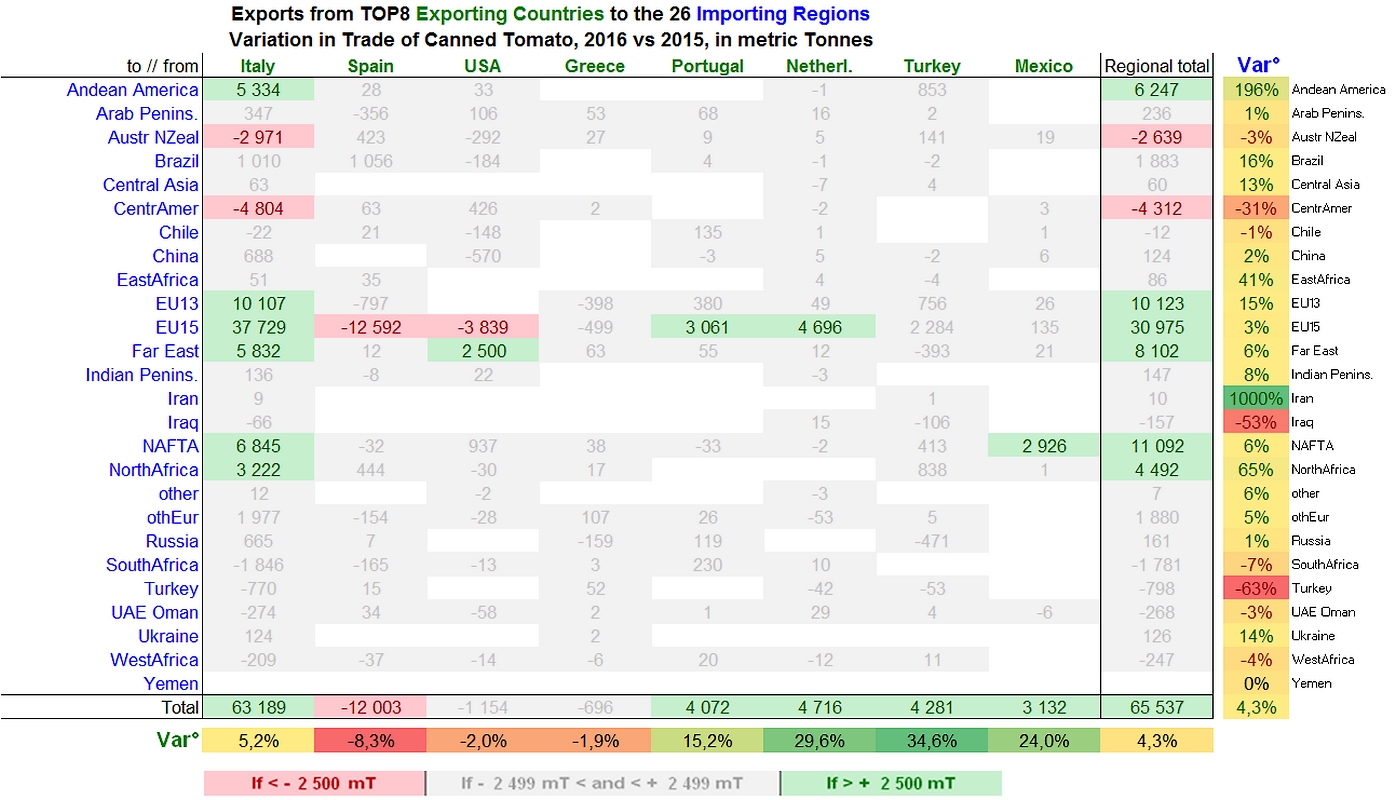
Canned tomatoes
Table of variations recorded for each of the eight main exporting countries for the canned tomato category to each of the 26 destination regions: most of the changes occurred in the European consumption region and concerned export volumes shipped by Italian operators.
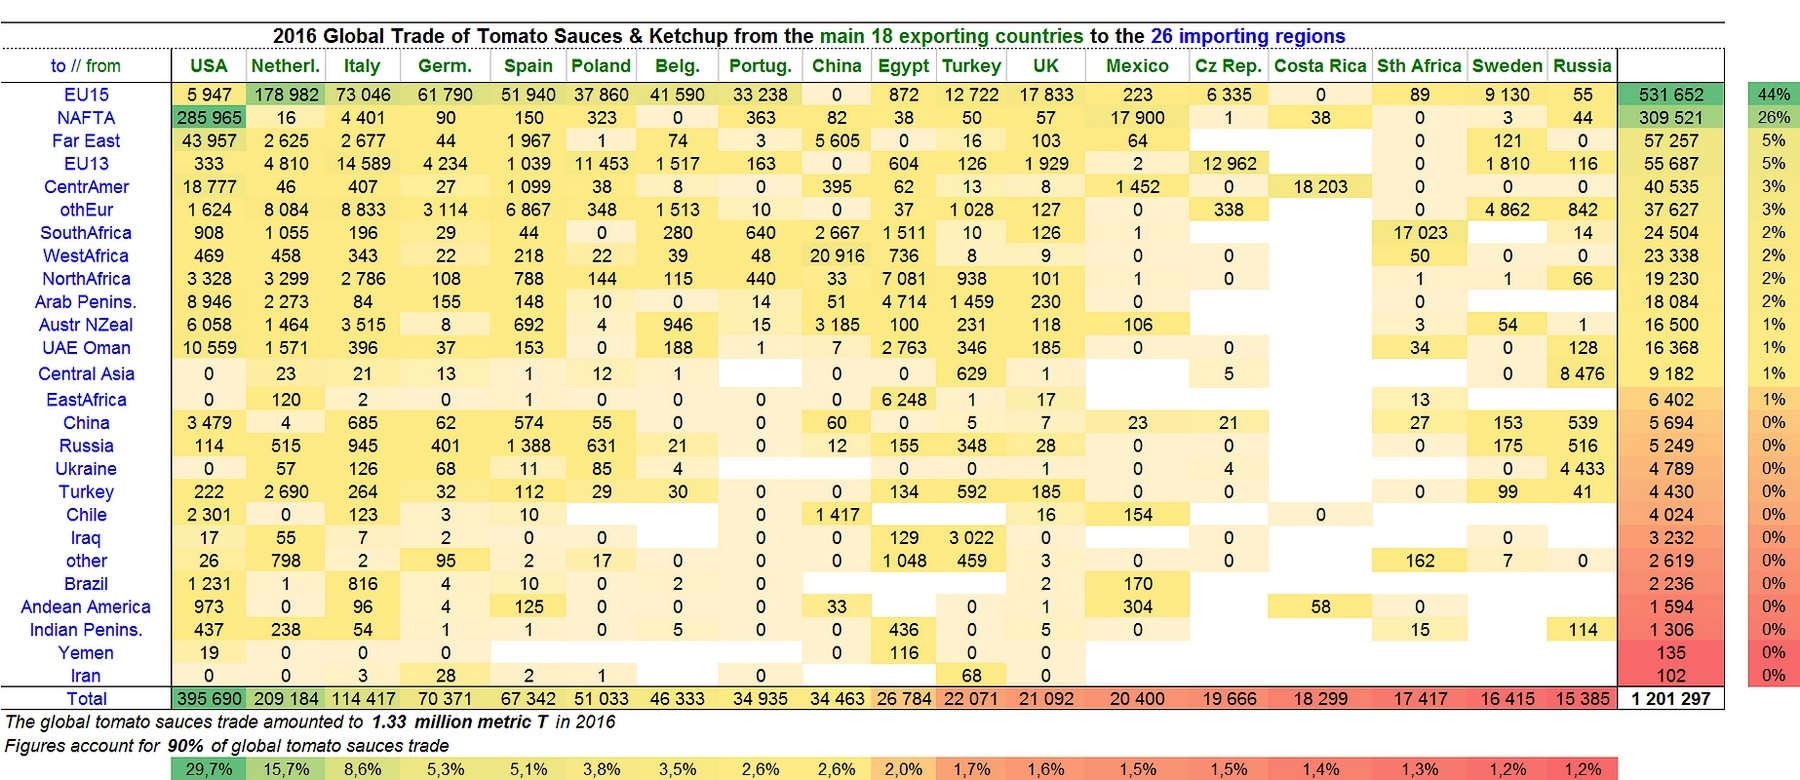
Ketchup & tomato sauces
Synthetic presentation of 2016 exports of sauces & ketchup, from the 18 main processing countries to the 26 different consumption regions. Stated figures account for more than 90% of worldwide trade for the year.
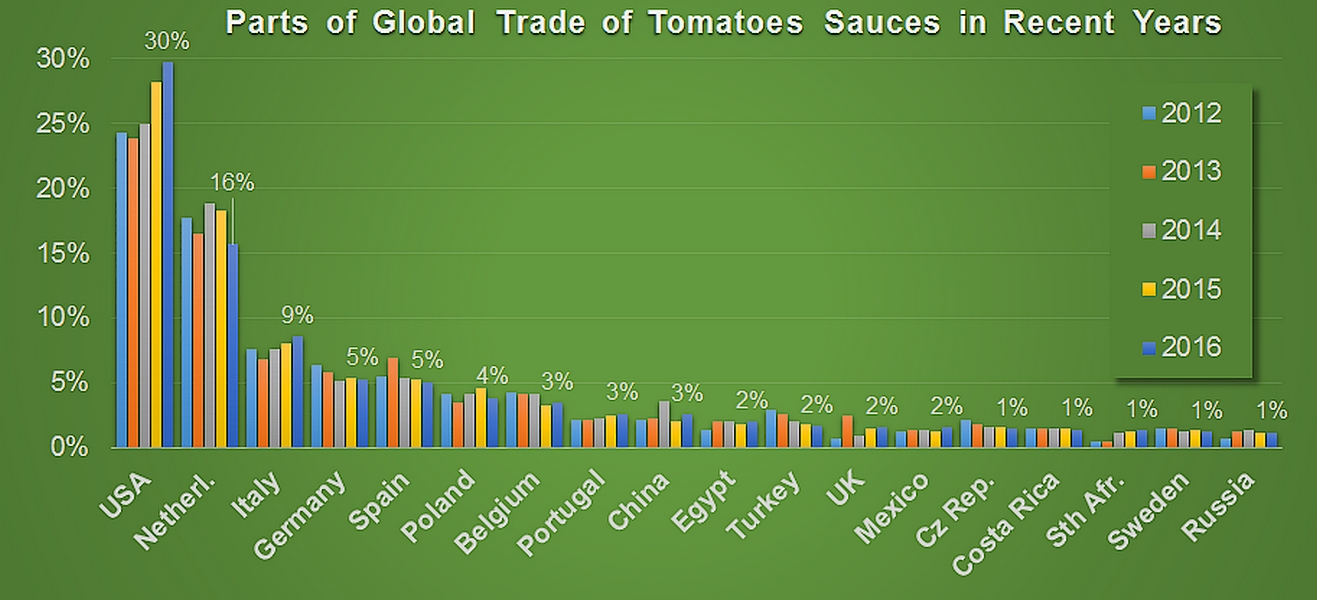
Evolution of the market shares of worldwide sauces & ketchup exchanges for the eighteen main processing industries.
Appendices/Annexes