U.S. inventory levels are historically low
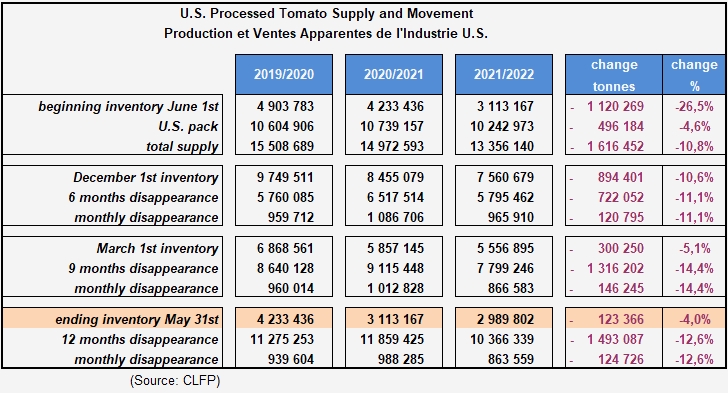
According to the June 21 report by the California League of Food Producers (CLFP), total stocks of processed tomato products available as of June 1, 2022, in the United States were just under 2.99 million metric tonnes (mT, or 3.3 million short tons (sT)), expressed in fresh tomato equivalent. One has to go back about 15 years – between 2005 and 2007 – to find such low levels of tomato product stocks in the United States. The comparison, which is very relative due to population changes, only partially reflects the current situation, since the quantities available per capita as of June 1, 2022, (less than 9 kg/capita, expressed in fresh tomato equivalent) are significantly lower than those of June 1, 2007 (9.5 kg/capita), and reveal a more marked shortfall (-1.4 kg/capita this year compared to -0.9 kg/capita in 2007). At the current rate of apparent consumption, available stocks should be sufficient to meet demand until mid-September.
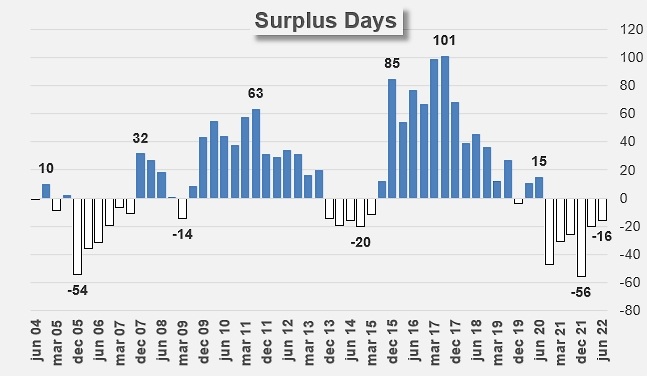
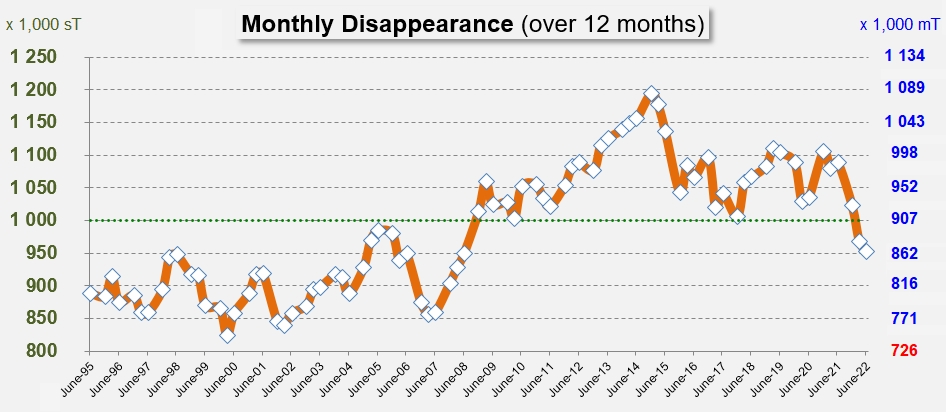
However, it is important to view this timeframe with caution, as the situation on June 1 also confirms a trend towards a decline in apparent consumption (domestic consumption and exports), which could artificially extend the "longevity" of the stocks still available; According to the figures published by the CLFP, annual sales have not exceeded 10.37 million mT (fresh tomato equivalent), a result 12.6% lower than what was recorded in June 2021 and which corresponds to a historically low monthly sales rate of around 860,000 mT, which the sector had not observed since June 2008.
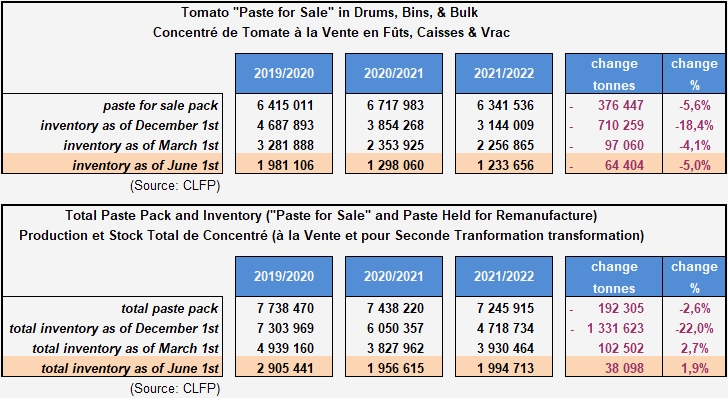
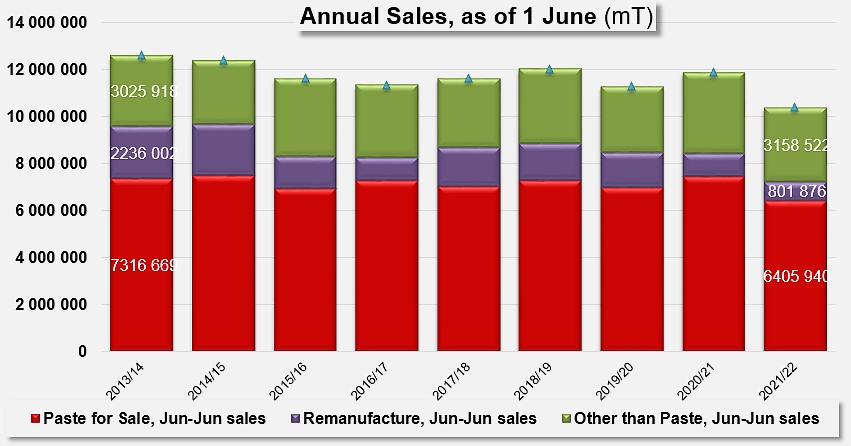
The breakdown of sales by product category shows that all sectors have been affected to varying degrees by this slowdown. Annual sales of the paste category as a whole (for sale and remanufacture) (7.2 million mT fresh tomato equivalent, from June 1, 2021, to May 31, 2022) have thus fallen by more than 14% compared to the previous period (June 2020-May 2021), with a more marked decrease for pastes intended for remanufacture (-18.7%) on relatively modest quantities (802,000 mT) than for products intended for sale, especially for export (-13.4%), on very substantial volumes (6.4 million mT).
At the same time, annual sales of products other than pastes have also fallen significantly, by around 9%, for significant volumes (3.16 million mT traded from June 2021 to May 2022) (see also additional information at the end of the article).
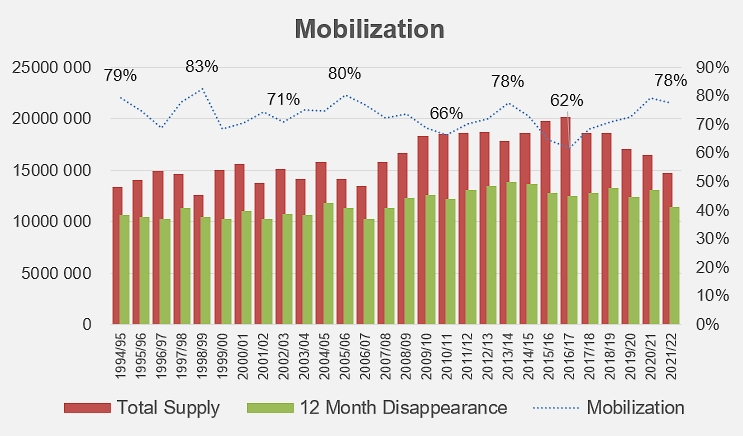
Based on the relatively modest quantity processed during the last season, the rate of apparent sales over the last twelve months, although reduced, is resulting in a tense situation, while being at the same time in line with forecasts by the sector's stakeholders and experts.
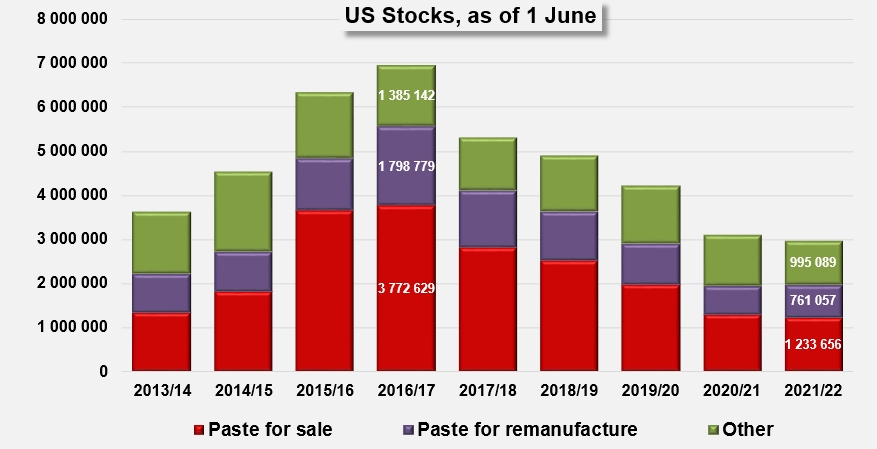
According to the CLFP report, total bulk tomato paste stocks, including inventory held for remanufacture, were estimated to total 1.99 million mT (2.2 million sT), on a raw product "paid-for tons" equivalent basis, as of June 1, 2022. This level is 1.9% higher than that recorded in June 2021.
Conversely, the U.S. bulk tomato paste-for-sale inventory on June 1, 2022, was approximately 1.23 million mT (1.36 million sT), on a raw product "paid-for tons" equivalent basis, 5% lower than the level recorded one year ago.
Current inventory and apparent consumption figures indicate a consumption trajectory for the next twelve months of approximately 11.5 million mT, slightly above the stated processing intentions of the entire US industry (12.19 million sT, valued as of May 15, 2022). If these projections prove to be reliable, the US marketing year could end in conditions close to those in which it began, marked by renewed tension concerning product availability.
Some additional data
Evolution in production and apparent sales data in the United States over the last three years.
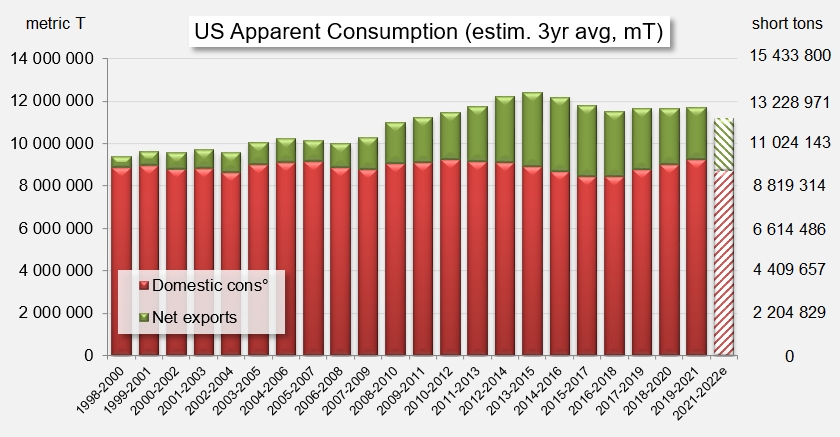
Based on the information available at the time of writing, forecasts for the domestic and export components of annual and three-year average apparent consumption as of June 1, 2022, seem to indicate that export operations have resisted erosion better than domestic consumption (see histogram of annual sales as of June 1 in the main body of this article).
The dynamics of inventory composition show an increasingly close match between its "production" and "apparent consumption" components.
Sources: CLFP