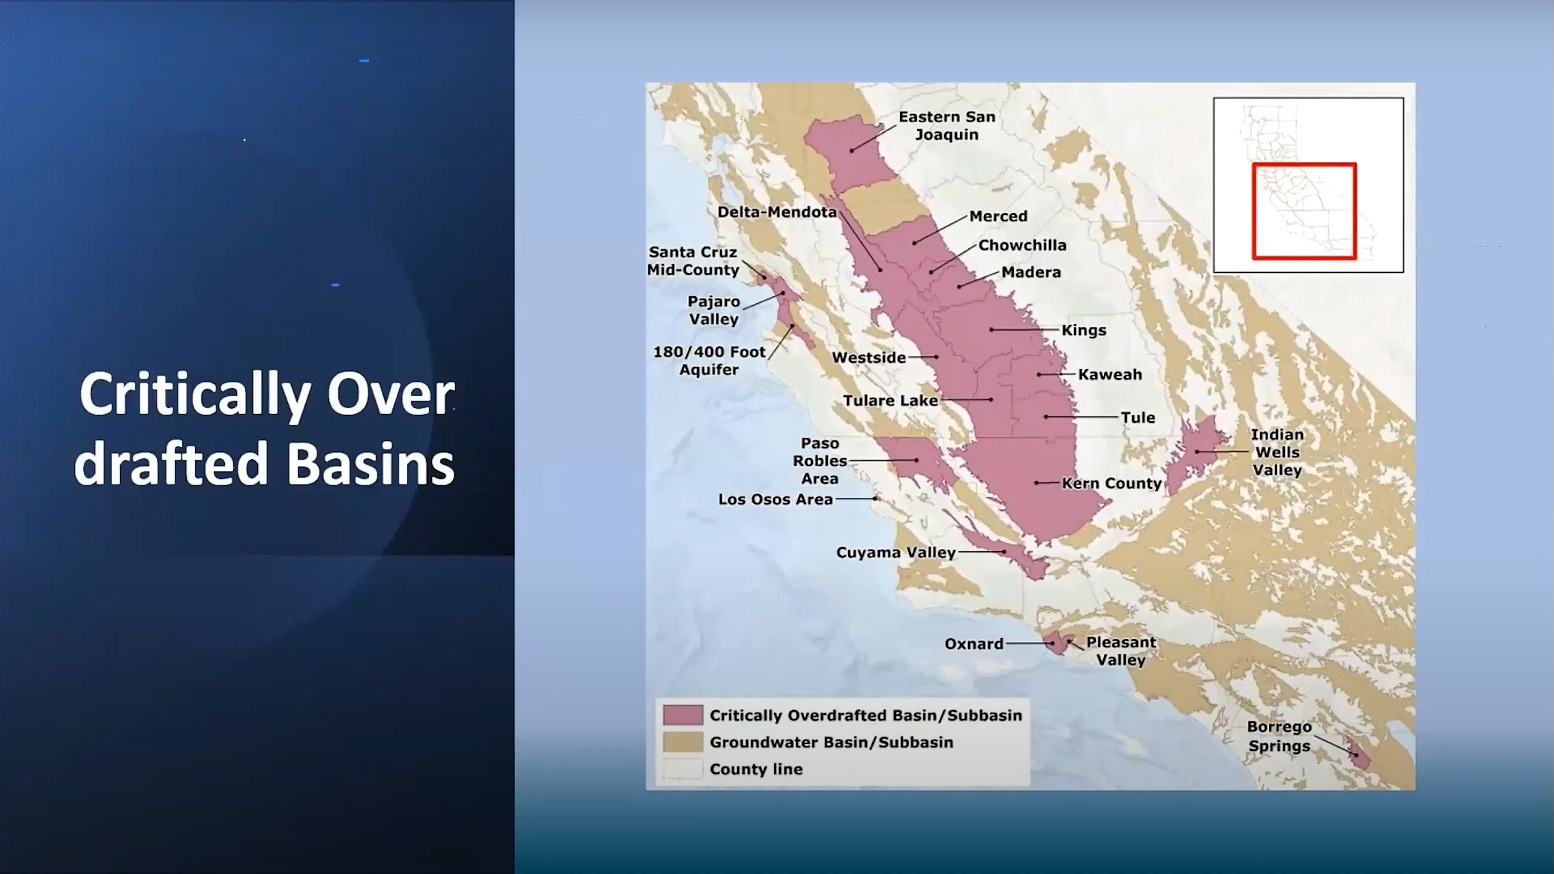
“The majority of California tomatoes are grown in critically overdrafted basins…”
From the presentation given by Don Cameron, President of the California State Board of Food and Agriculture, during the 14th World Processing Tomato Congress (March 2022, held online from San Juan, Argentina).
 “My presentation today is going to be covering water scarcity in California and also the sources of water available to Californian farmers. I will be concentrating on south of the Delta, which is in the mid-portion of the State, where 66% of California tomatoes are currently grown. I am also going to focus on Westland’s Water District, which is in western Fresno County, where historically around 29% of the tomatoes for the State have been grown.
It is really a microcosm of what is happening throughout California’s tomato-growing regions.
California tomato growers throughout the State have two major sources of water. There is a wide variety of water types throughout the State: surface water and groundwater that is being pumped from the underground. In California, we have seen increasing amounts of surface water allocated to environmental uses, such as Delta smelt and the Chinook salmon restoration, both listed as endangered species. We have also seen the effects of climate and extreme weather conditions throughout the State in recent years. Not only has rainfall been subject to wide variations, temperatures during the growing season have also become extremely variable. Last year, we had extreme heat spikes during June that caused tomato blossoms to drop and ended up reducing yields. This was also followed by very hot warm nights throughout the summer, that affected the crop. Of the two main water sources in California, the first is surface water that flows from the Sierra Nevada Mountains as snowmelt, usually captured behind reservoirs that are used for flood protection and then released for agricultural, municipal, industrial and environmental uses – this is the majority of the water that falls in the northern half of the State and moves south in rivers and through the Delta and then is pumped into canals and moved to the south of the state.
Our other source of water is groundwater pumped from various depths and used as a source more heavily during times of drought. So we will take a look at surface water first.
In California we have two main sources of surface water: we have the State Water Project (SWP) administered by California government and the Central Valley Project (CVP), which is administered by the Federal government.
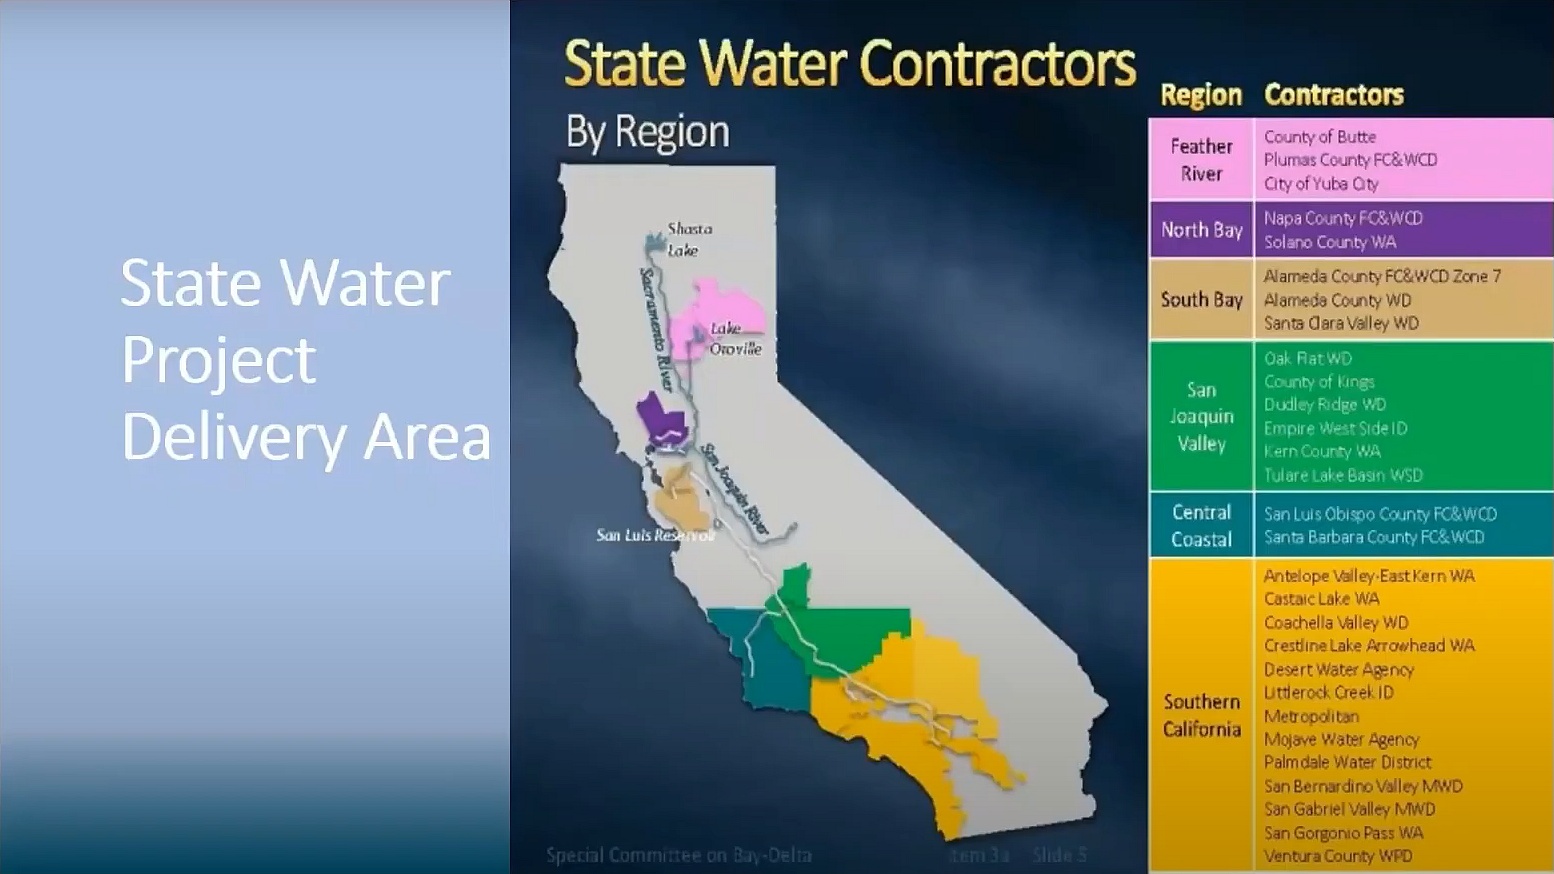
This illustration shows the State Water Project in purple, and the Central Valley Project in yellow. The State Project begins just north of the center of the State in Lake Oroville, proceeds south in various cities and over farmland. The Central Valley Project begins in the far north of the State where the two yellow circles represent large reservoirs – Shasta being the keystone for the Project. This water moves south through the blue area, which is the Sacramento River, into the Delta and then is pumped into the California aqueduct and one other canal to move south, traveling all the way down almost to San Diego.
The State Water Project delivers water to agriculture, municipalities, industry and the environment from Lake Oroville all the way down to San Diego, to the yellow area. The green area is Kern and Kings County, strong growers of early tomatoes and Kings of full-season crops.
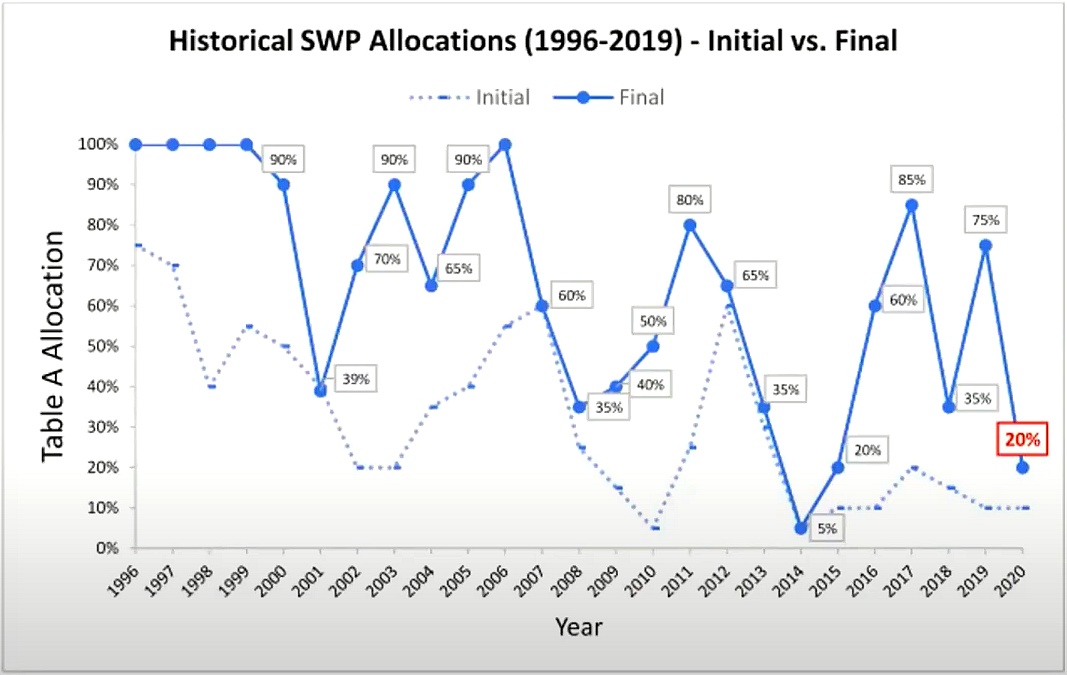
This is the historical State Water Project allocation, with the initial allocation and then the final allocation. Most years, these levels would have increased – on the far-left side of the screen, back in the 1990’s, you saw 100% allocations. As you look further through some of these valleys, you will see some of the severe droughts that we encountered from 2012 to 2017, and also the flooding that we had – the really high rainfall years 2006, 2011, 2017 and 2019. And even during flood periods, you don’t get to 100% anymore: we are seeing 85%, and 75% deliveries even when the State has flood flows.
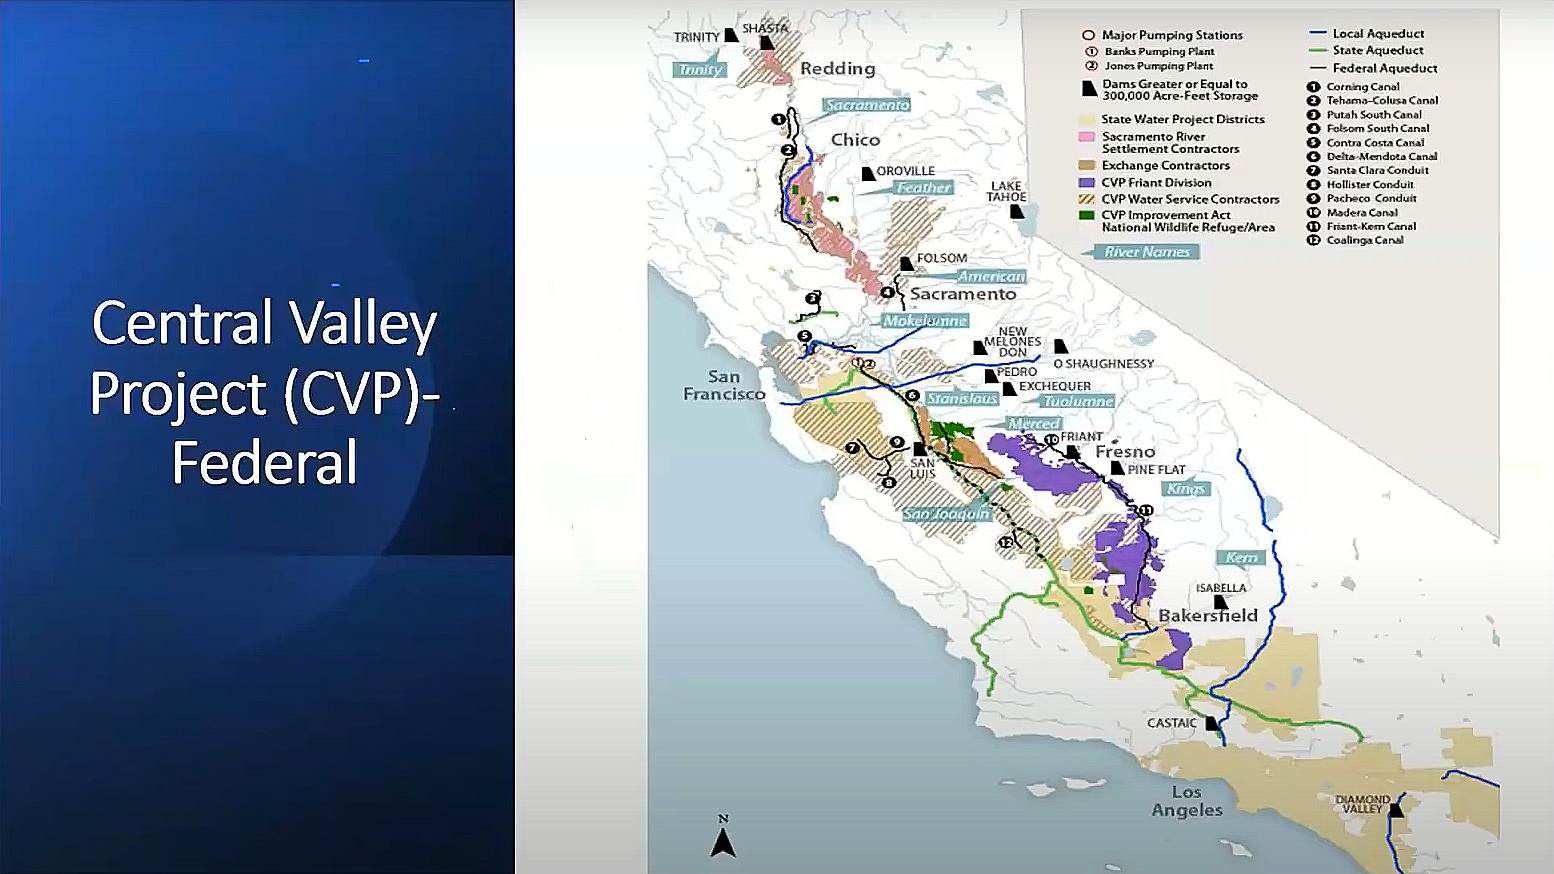
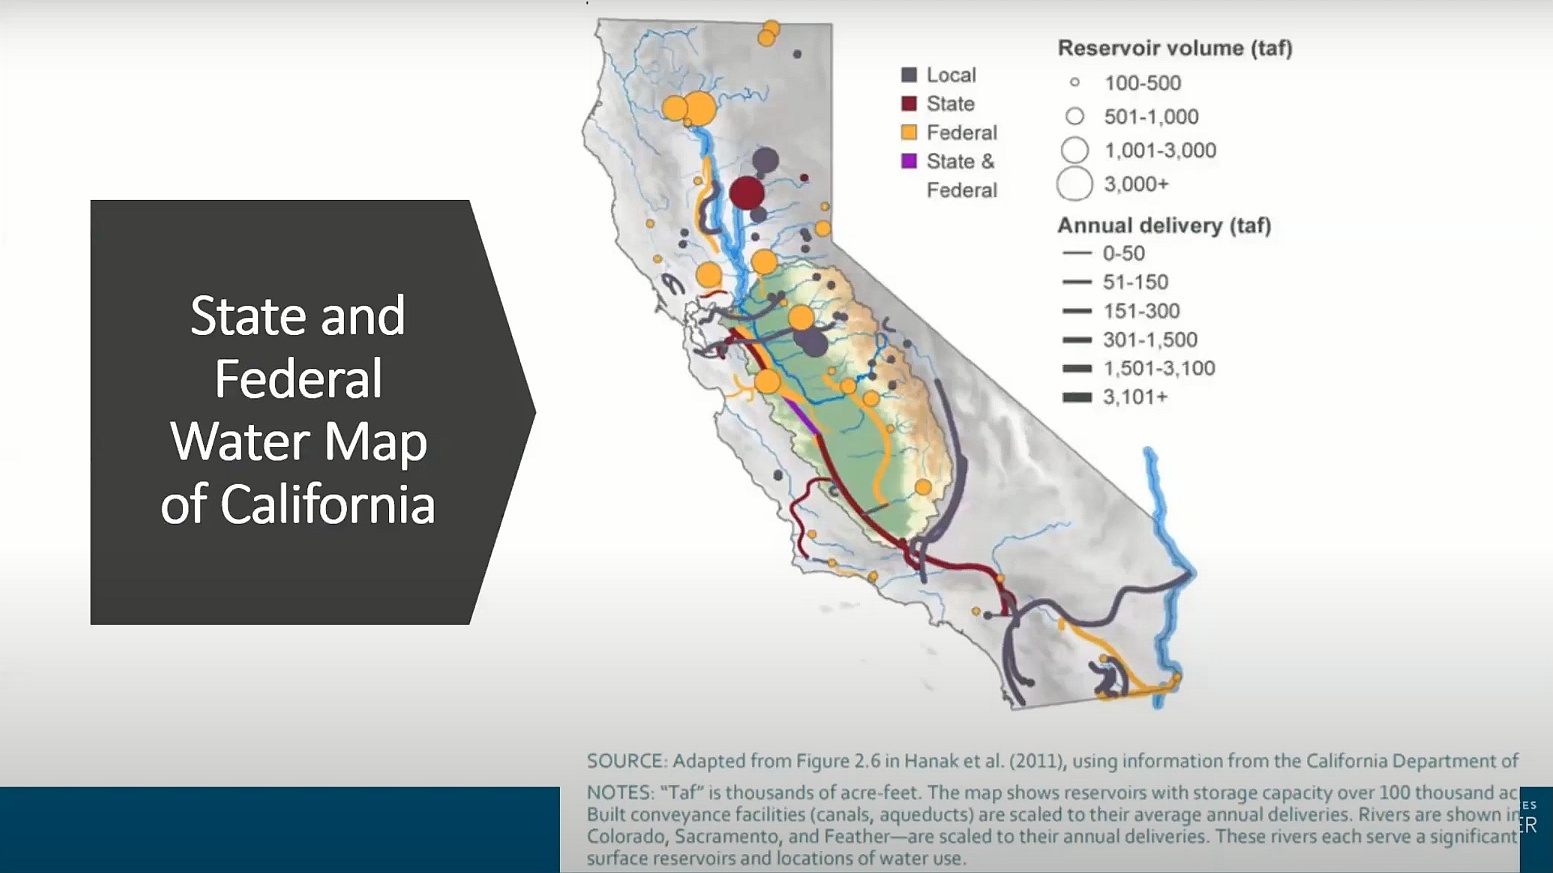
This map of the Central Valley Project begins at the north end of the State with Shasta Lake. Shasta is capable of holding four and a half million acre-feet (5.551 km3) of water in wet years. The rainfall and snowmelt travel from far northern California to the urban and agricultural areas throughout the State primarily for agriculture, 75% terminating in the south end of the San Joaquin Valley, after about 450 miles.
As I said, we have about 450 miles of running water, with 20 dams and reservoirs, and 500 miles of canals and infrastructure. The Project manages over 9 million acre-feet (11 km3) of water and annually delivers 7 million acre-feet (8.6 km3). It provides 5 million acre-feet (6.2 km3) for farms covering over 3 million acres, a third of the agricultural land in California. It also supplies 600,000 acre-feet (0.74 km3) for municipal and industrial uses, which is about a million households in California. It also supplies 800,000 acre-feet (0.98 km3) for fish and wildlife purposes, with another 410,000 acre-feet (0.5 km3) for wildlife refuges and wetlands throughout the State.
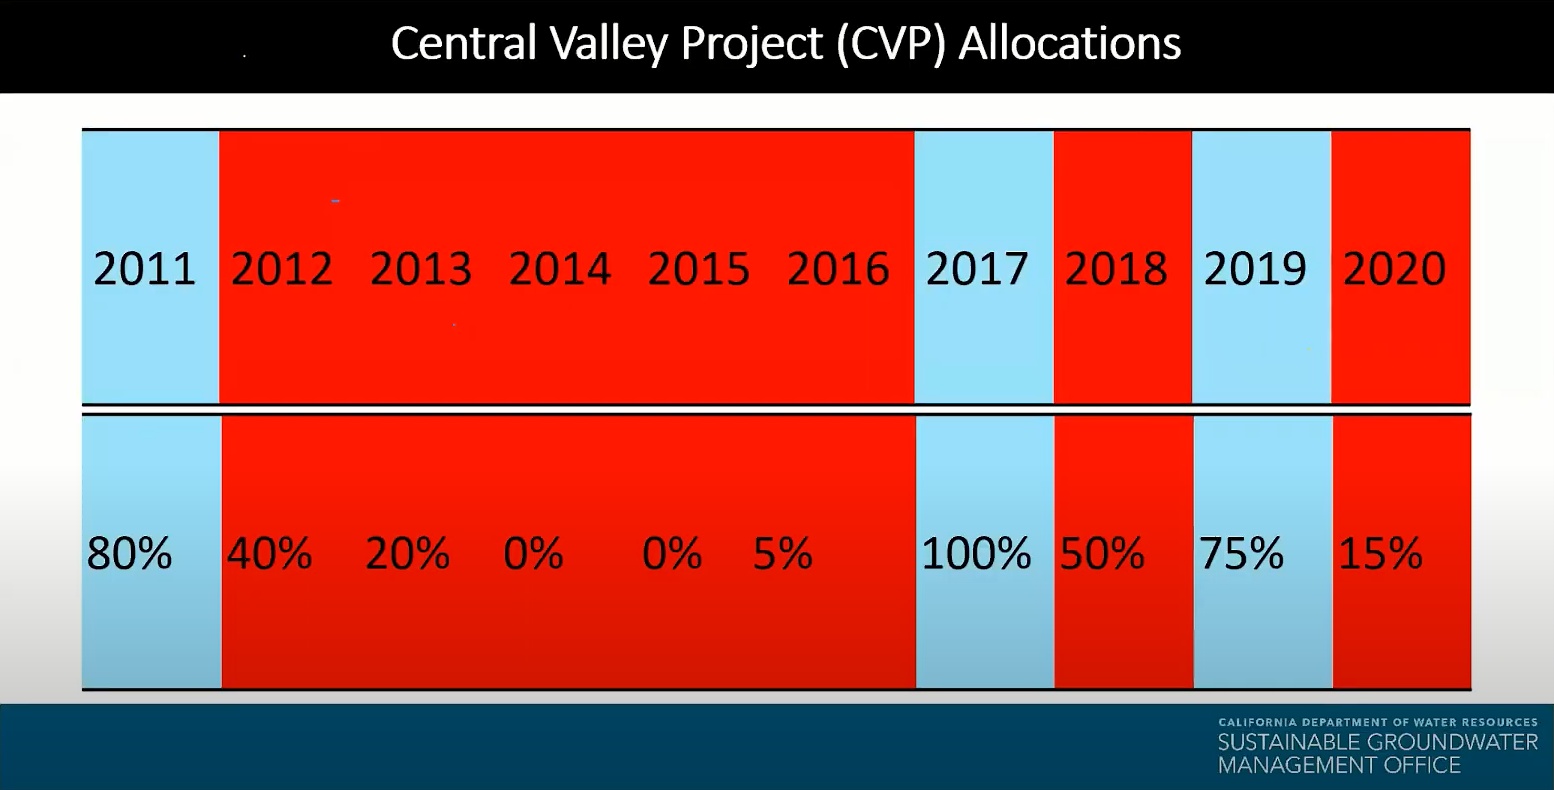
This chart shows the allocations from 2011 to 2020 for the Central Valley Project. This is what feeds the majority of agriculture and this is what the allocations have been for Westland’s Water District in Fresno County. From a flood year in 2011, they received 80%. During the five years of drought, several years of 0% and then back up, actually 100% in 2017 – a flood year, and in 2019, 75%, another flood year. The current allocation this year is 0%.
Let’s talk about groundwater for a moment, so you have some background of what happened in California. In 2014, Governor Jerry Brown signed a three-bill legislative package into law known as the Sustainable Groundwater Management Act (SGMA). This legislation created a framework for managing groundwater to reach sustainability over a 20-year planning period and implementation horizon.
Sustainable Groundwater Management emphasizes that “groundwater is best suited to be managed at the local level” and directs local agencies to work together to create Groundwater Sustainability Agencies (GSA) and then for them to develop and implement groundwater sustainability plans that will lead to long-term groundwater sustainability.
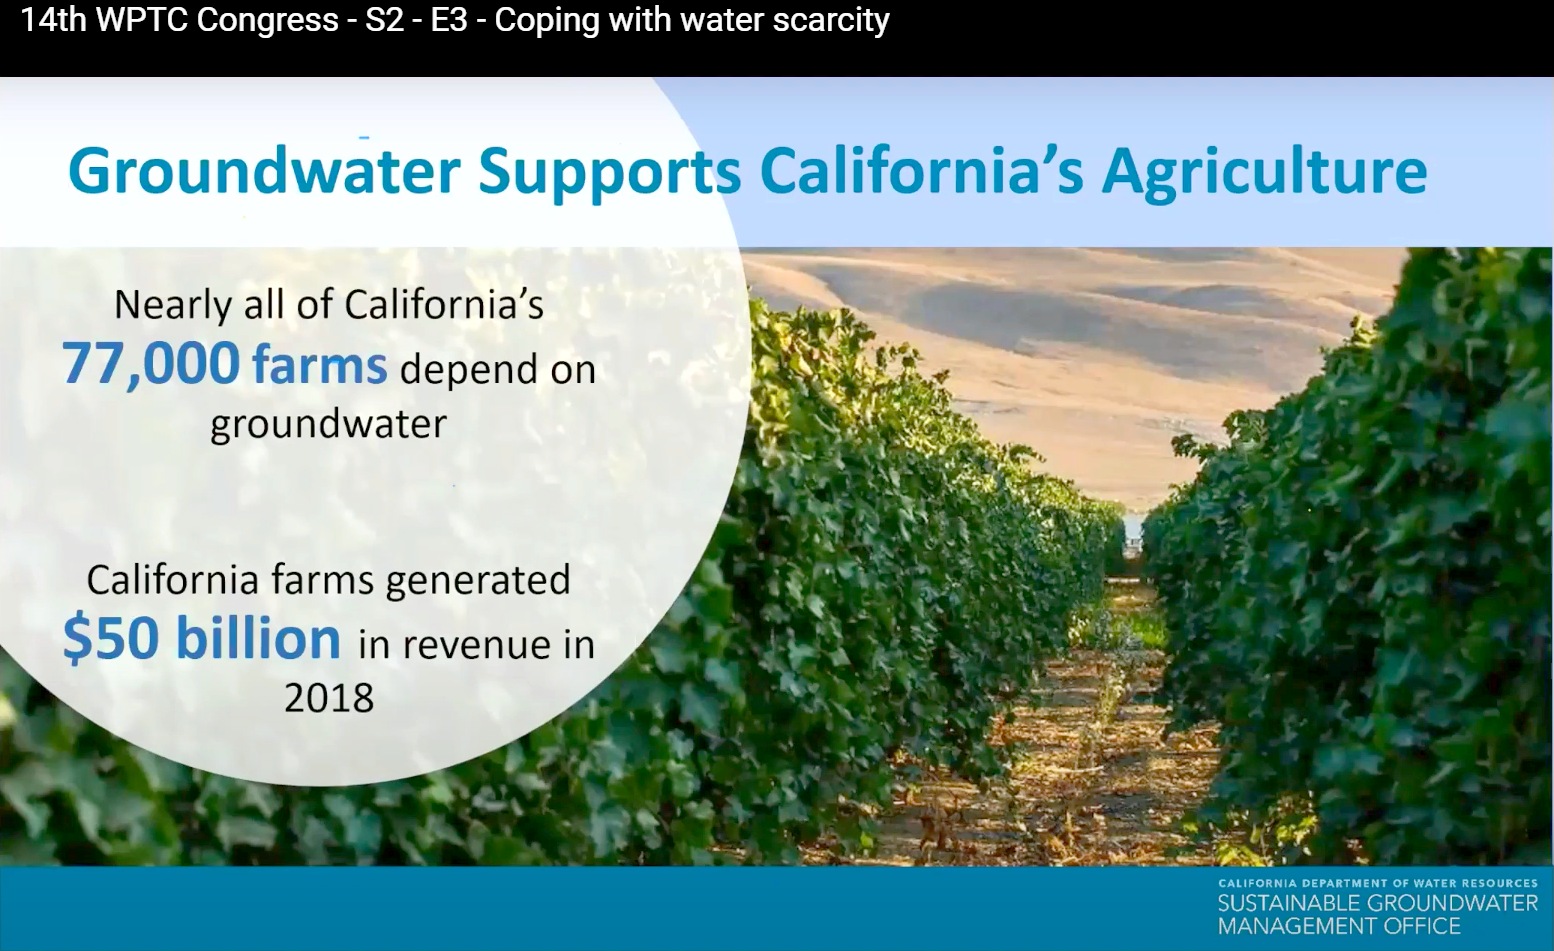
We have seen that groundwater supports California’s agriculture – nearly all of California’s 77,000 farms depend in one way or another on groundwater. According to the California Department of Food and Agriculture, California farms generated 50 billion USD of revenue in 2018. Groundwater also supports California’s water supply: nearly 40% of California’s water supply comes from groundwater in wet or normal years. In dry years, it goes up to 60%, and approximately 85% of Californians rely on groundwater.
For over a hundred years, surface water has been actively managed in California, capturing the snowpack and rainfall in lakes, rivers and streams and moving it through man-made canals. Sustainable Groundwater Management is relatively new, in the context of a statewide effort to balance the use of surface water and groundwater. It actually was put in legislation passed in 2014, but in reality, the main work was carried out over the last three years, bringing together the agencies from the different parts of California and putting together plans that have been submitted to the Department of Water Resources.
There are a lot of different stressors that have been impacting the groundwater and making it more vulnerable for years. Some regions have pumped more groundwater than can be easily replenished. This over-pumping has led to historically low groundwater levels, subsidence, loss of domestic drinking water in socially disadvantaged communities, and other issues.
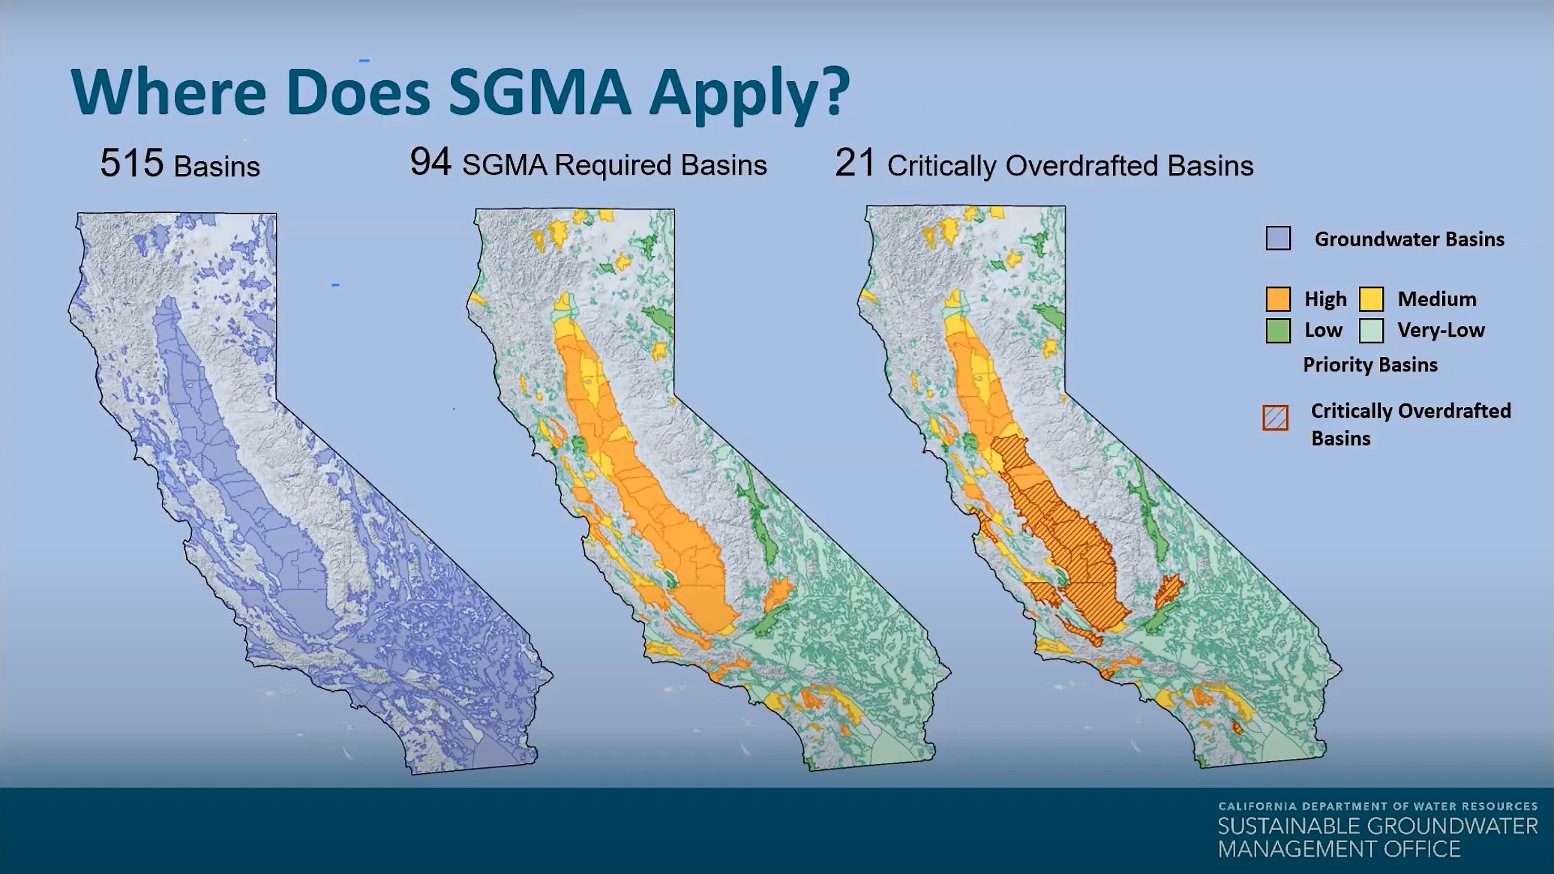
This slide really shows the heart of the groundwater situation in California. On the left are 515 groundwater basins. 94 of those basins are prioritized as high and medium basins required to comply with SGMA by forming Groundwater Sustainability Agencies and developing plans. 21 of the basins are additionally designated as “critically overdrafted” from excessive pumping of groundwater. And the majority of California tomatoes are grown in critically overdrafted basins. We have been talking a lot about everything south of the Delta and I will continue that – but you need to understand that this situation is not only in the southern half of California. This also includes areas to the north of Sacramento that are having similar issues throughout the State.
These areas have already submitted their Groundwork Sustainability plans in 2021 and all of the agencies have heard back, in the critically over-drafted basins. Eight of them have passed scrutiny, but 12 of them have failed and will have to resubmit with changes by July 2022. If they fail a second time, the basin goes into probationary, and the State may step in and restrict pumping, and charge exorbitant fees to the growers, which is not what any of us want.
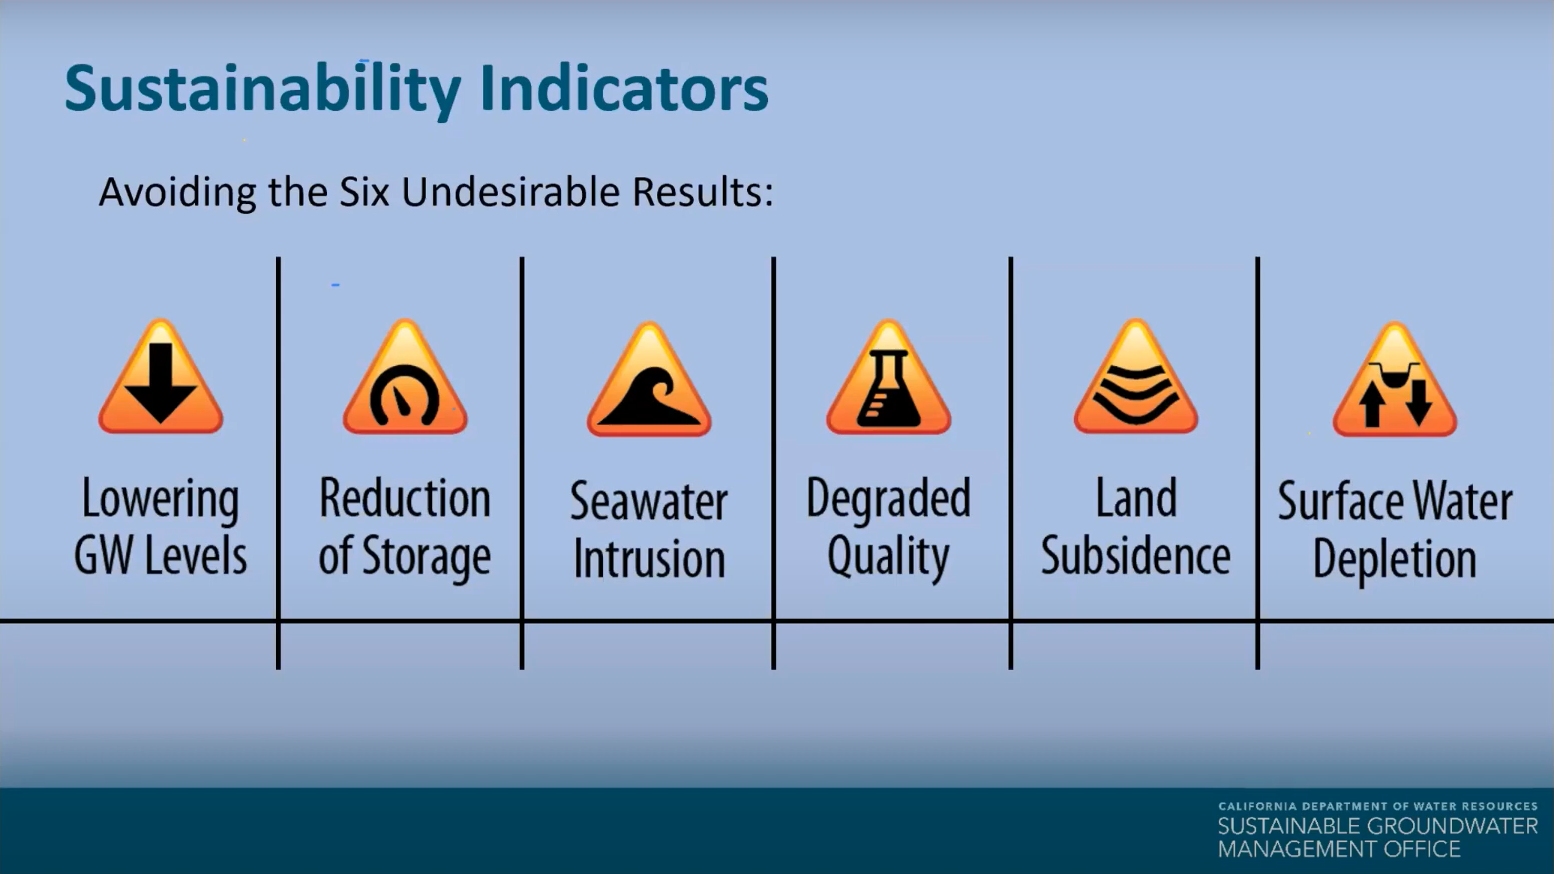
These are what we call the six sins of the groundwater: the GSA and their plans must address each of these issues if they fall within their jurisdiction, stating how they will minimize and avoid undesirable results such as groundwater level declines, groundwater storage reduction, sea water intrusion, water quality declines, land subsidence and surface water depletion. These are also referred to as the sustainability indicators.
Some complementary data
Video of the Conference is available at:
https://www.youtube.com/watch?v=xwNRr50G_nc
This article is the second of four parts of a dossier devoted to the water situation in California, which will also present how some California processors partner with companies specializing in industrial water recovery to produce water.
Sources: World Processing Tomato Congress (whova.com), marketplace.org