2022 results, boosted by a rebound in processing, are up 24% against 2021 results and 7% against the three-year period prior to the Covid health crisis.
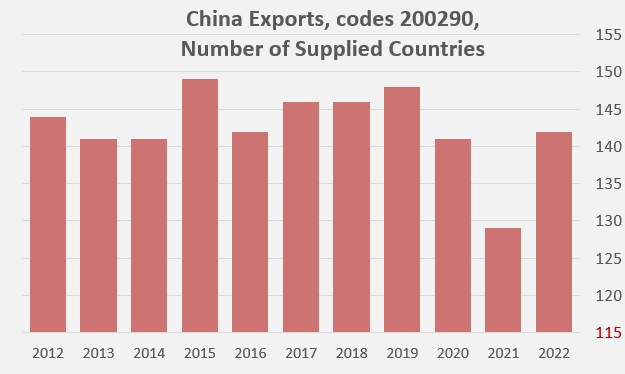
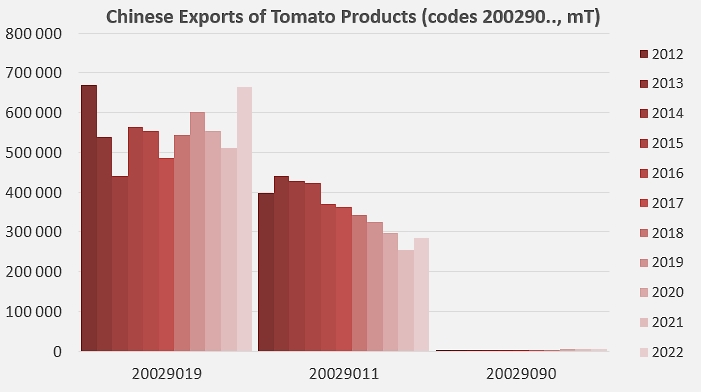
Chinese official exports of processed tomato products (codes 200290) amounted in 2022 (January 1 to December 31) to just over 954,000 metric tonnes (mT) of finished products, a significant increase of 24% compared to the result recorded in 2021 (770,000 mT). This performance has been the result of a new increase in the number of countries supplied (142 last year) after a sharp and dramatic contraction during the Covid pandemic (129 in 2021) but, more importantly, it has seen export operations exceed their average levels from before the health crisis. Buoyed by a significant increase in crop yields and quantities processed in 2022 (see additional information and our related articles below), export volumes last year were also 7% higher (nearly 64,000 mT of finished products) than they were during the three-year period (2017-2019) prior to the health crisis.
In terms of qualities, products conditioned in packs of more than 5 kg (codes 20029019), generally intended for industrial customers, have shown a clear upward trend over the past ten years and have contributed to the bulk of the development of Chinese foreign activity. This product segment accounted for approximately 70% of volumes and sales in 2022 (compared to 50-55% in volume and value in 2013-2014), while a succession of annual slowdowns has resulted in products exported in packs of less than 5 kg (codes 20029011), generally intended for catering and retail, accounting for only about 30% in volume and value of the Chinese exports in this sector.
For the record, the value of Chinese exports of products under 20290 codes in 2022 was USD 912 million, a level not seen since 2015 (USD 925 million). This result is a consequence of both an acceleration in quantities and an increase in unit prices, which can be estimated at approximately 26% compared to the annual average price levels of the pre-Covid period (2017-2019).
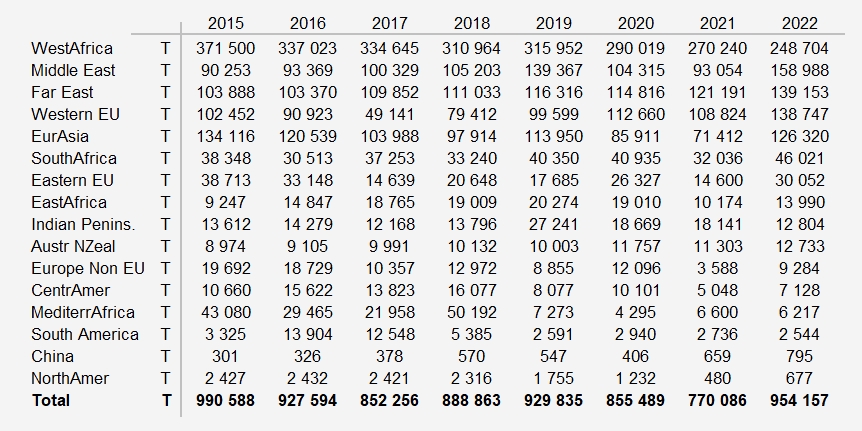
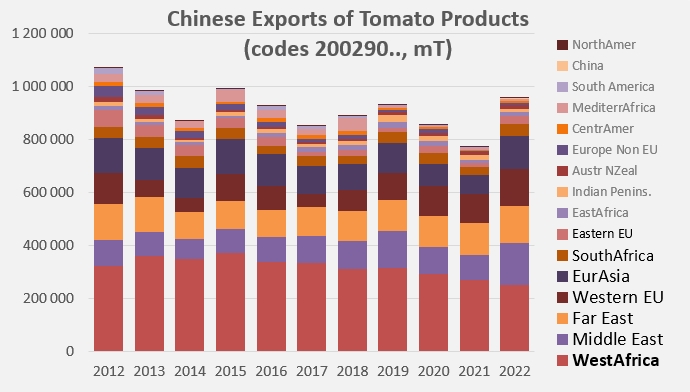
Geographically, Africa remains the primary customer base for Chinese products, as well as the main driver of the declines in operations that can be observed in 2022. With a total export volume of approximately 249,000 mT of finished products, Chinese activity in the region as a whole recorded a decline of more than 21,000 mT (-8%) compared to 2021 and nearly 72,000 mT (-22%) compared to the three years preceding the pandemic. The most significant declines affected the region's leading markets (Ghana, Nigeria, Togo, Benin, Cote d'Ivoire, Cameroon, Guinea, etc.) and could not be offset by the more measured increases recorded for smaller outlets (Congo (Republic and Democratic Republic), Sierra Leone, Senegal, Mauritania, Niger, etc.). The disappearance of sales to Algeria, which have been completely eliminated since 2021, has had a clear impact on Chinese activity, while more or less marked slowdowns in Japan, Sudan and Djibouti, India, Haiti, Brazil and, to a lesser extent, several other countries, have also affected the Chinese results for 2022. Conversely, with the exception of West Africa, significant increases in exports have been recorded for most regions or countries of strategic importance to the Chinese industry: Saudi Arabia, Iraq and Israel, the Philippines; Thailand, Indonesia and Vietnam; Italy, Spain, Portugal and Germany; Russia and Turkey; South Africa and Angola, and Poland (see additional information at the end of this article).
Some complementary data
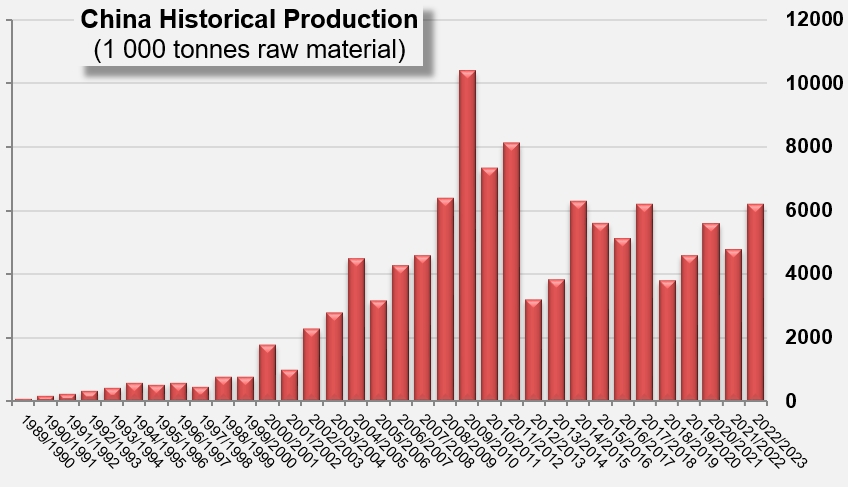
Historical overview of Chinese processing
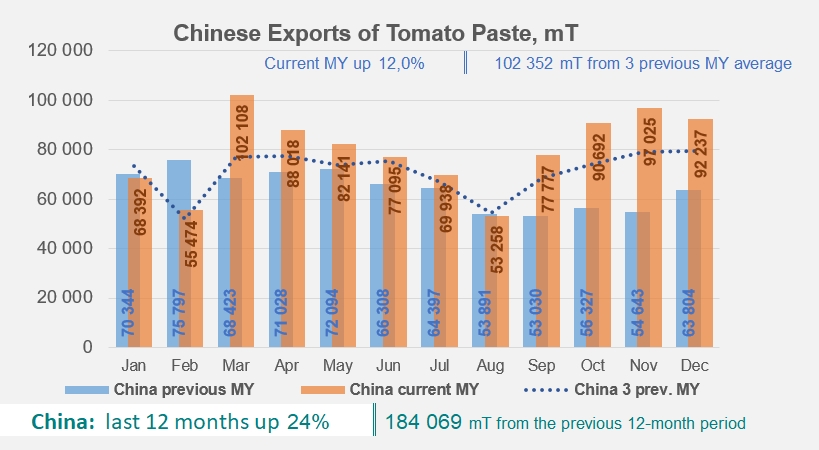
Comparison of the results of the last 12-month period with those of the corresponding period of the previous year and with the average of the equivalent periods of the three preceding years. These results are presented each month in our article dedicated to the worldwide trade in pastes, along with Chilean, Greek, Italian, Portuguese, Spanish, Turkish, Ukrainian, US, Iranian and global figures.
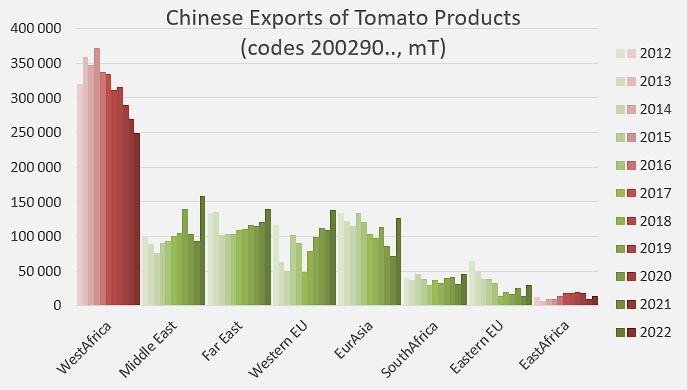
Evolution of Chinese exports (codes 200290), by region
Quantities exported by the Chinese industry since 2015 (codes 200290).
Source: Trade Data Monitor, WPTC