The tomato paste trade in 2017/2018
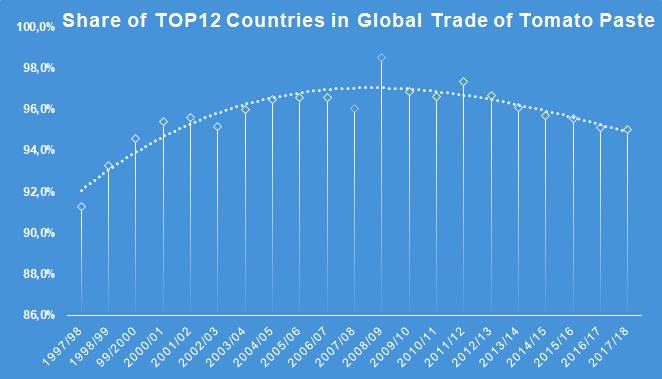
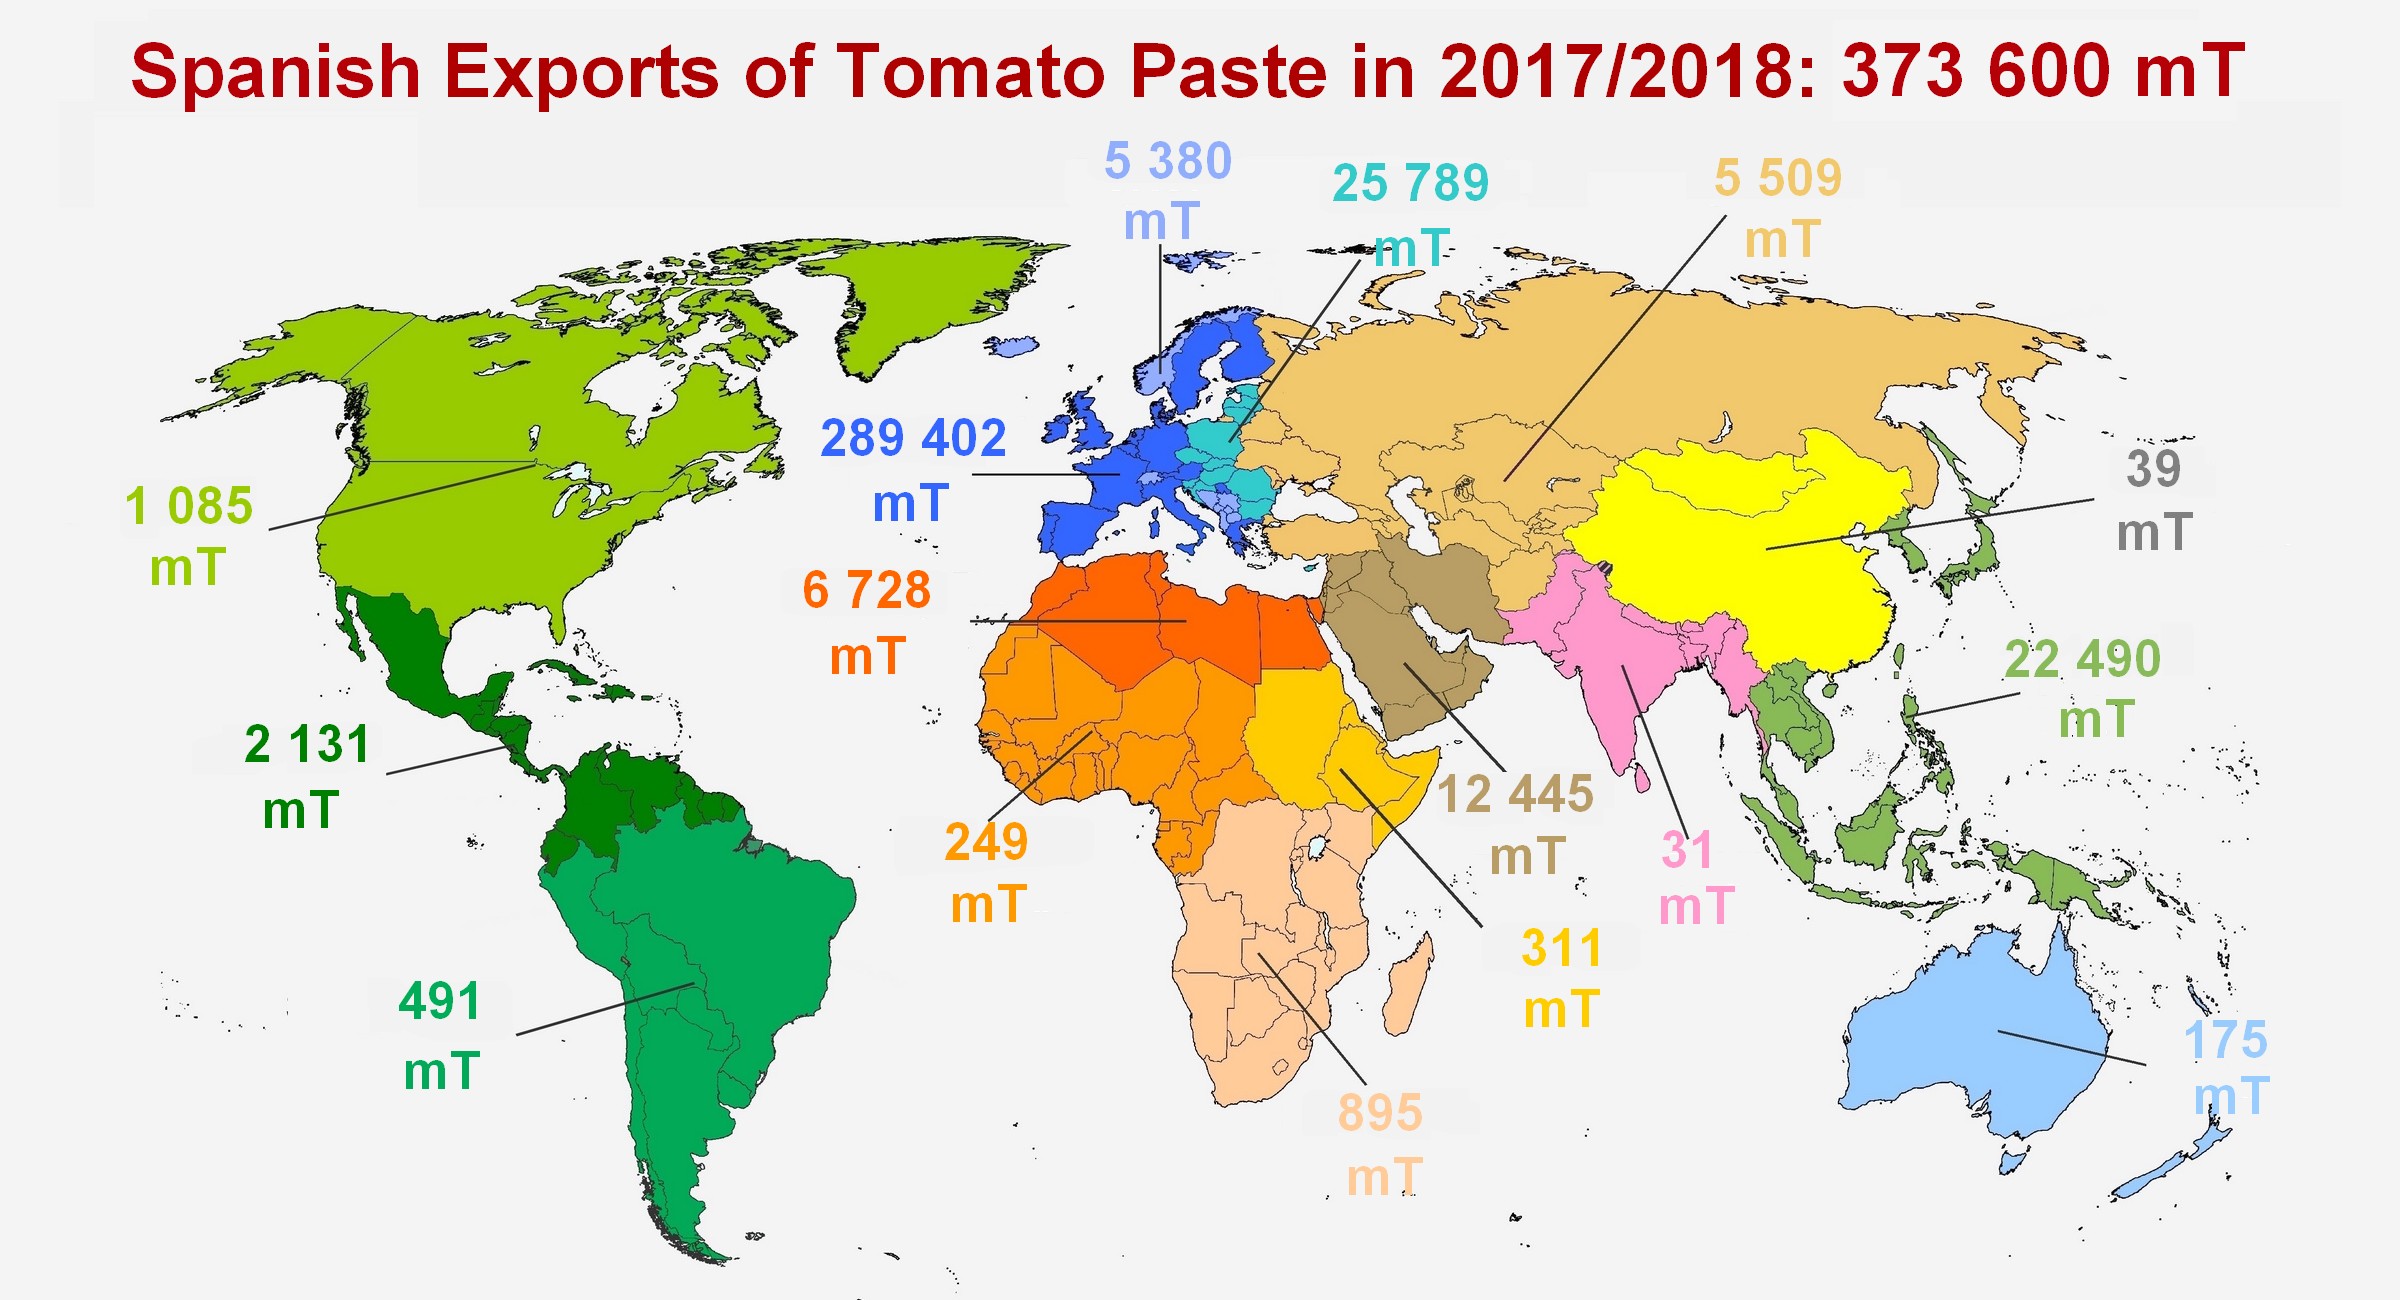
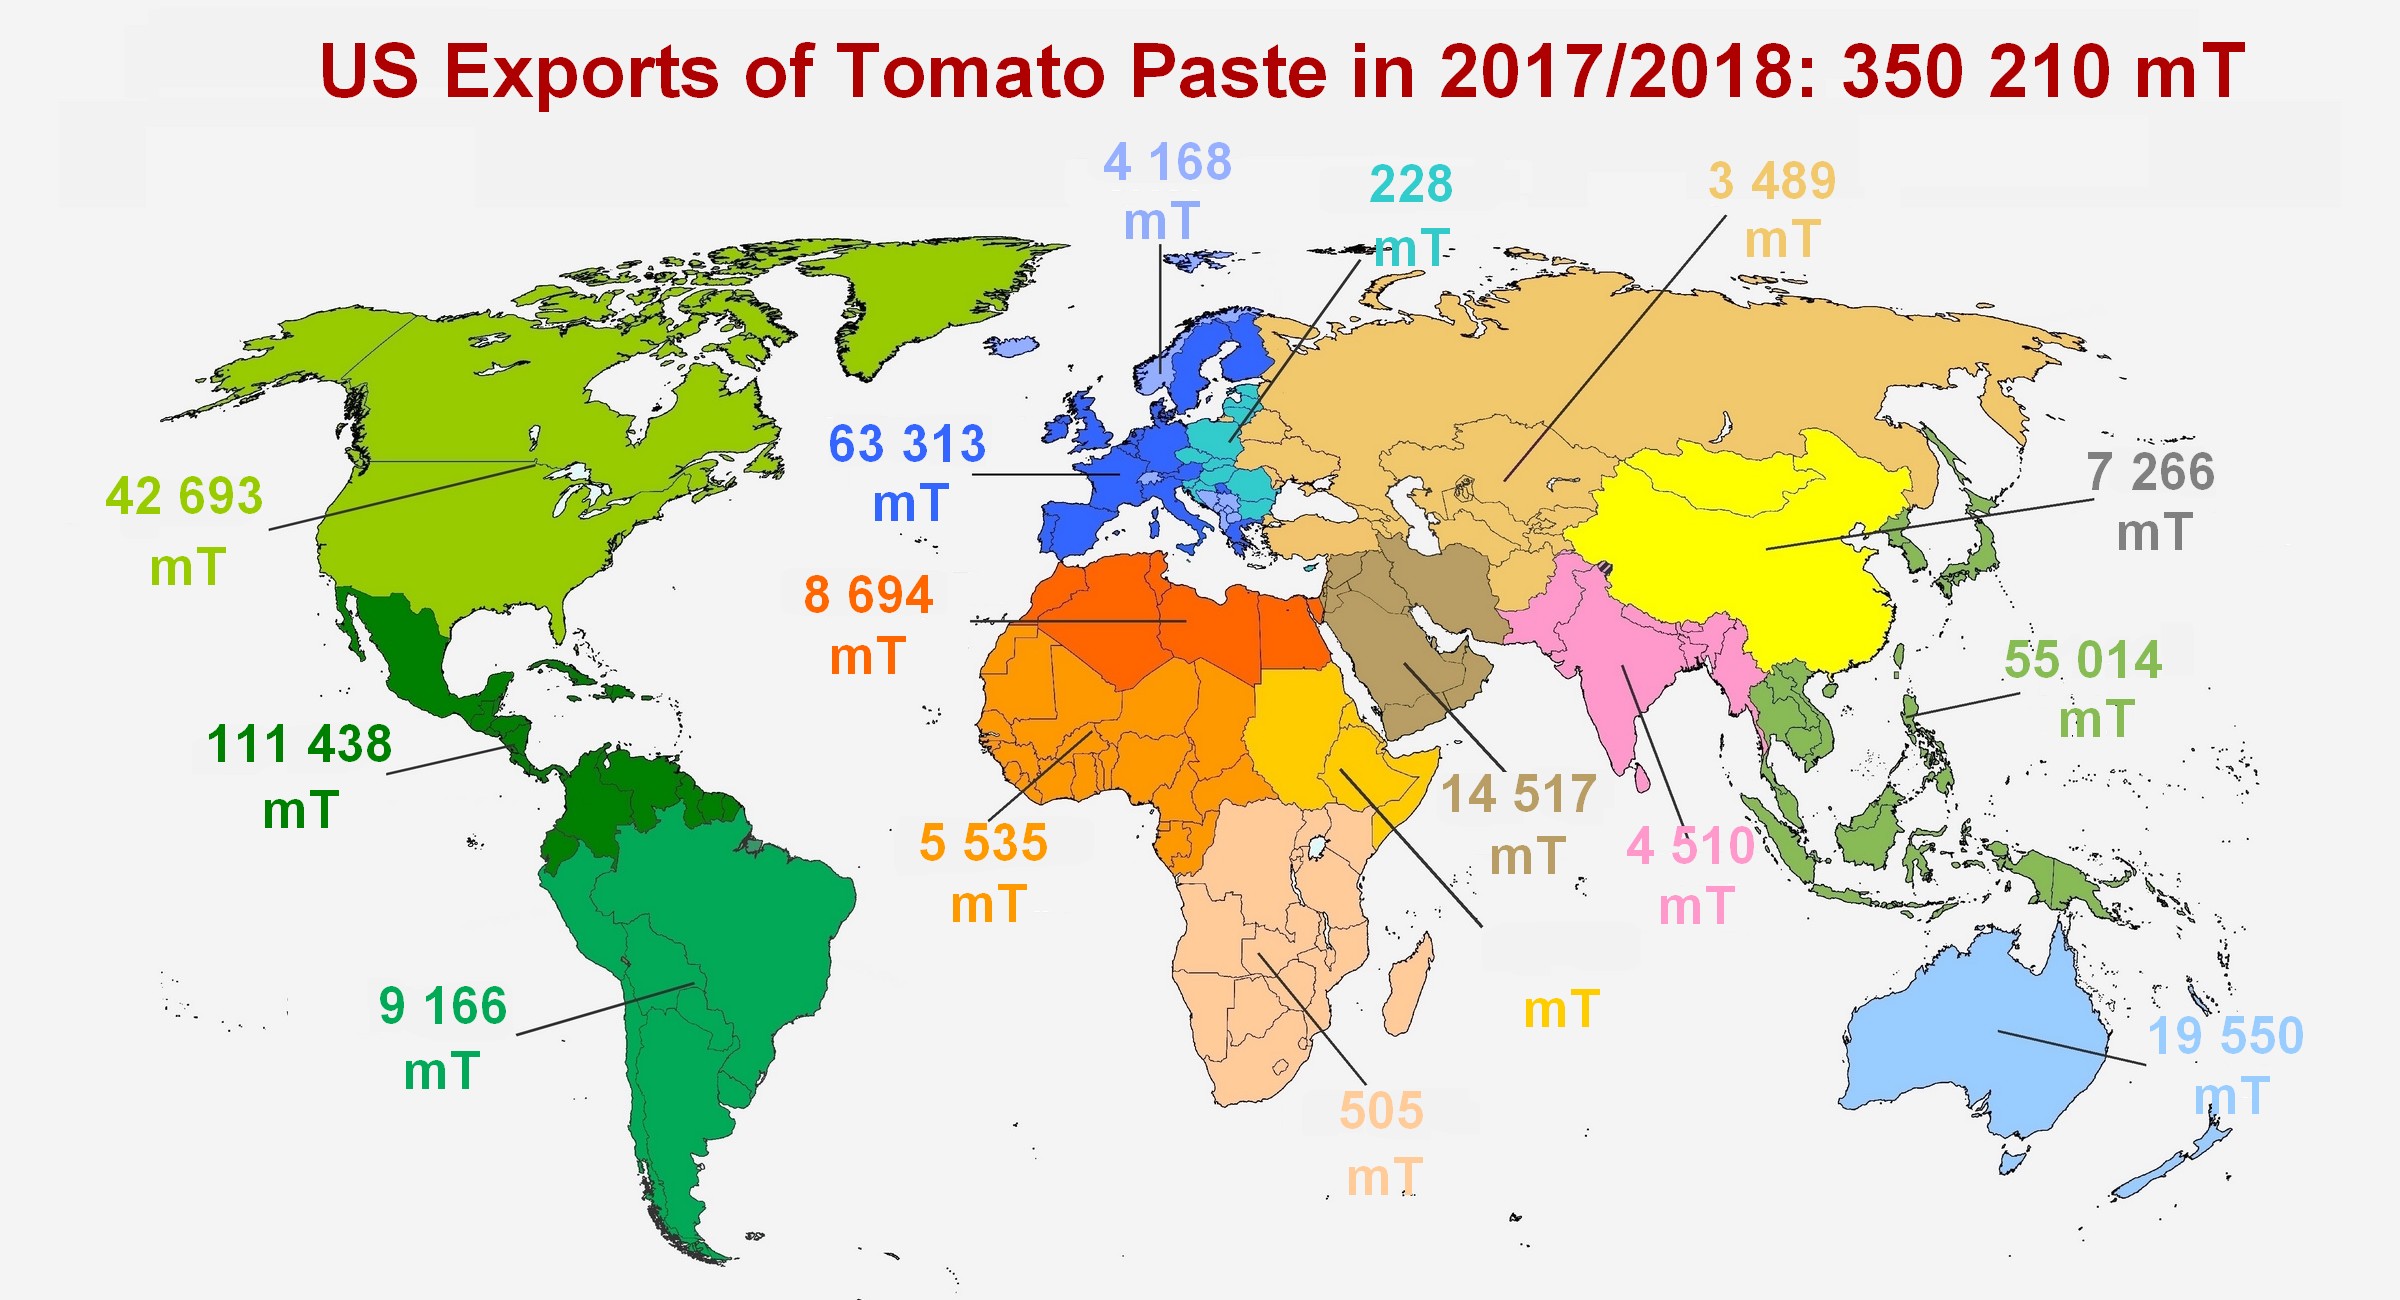
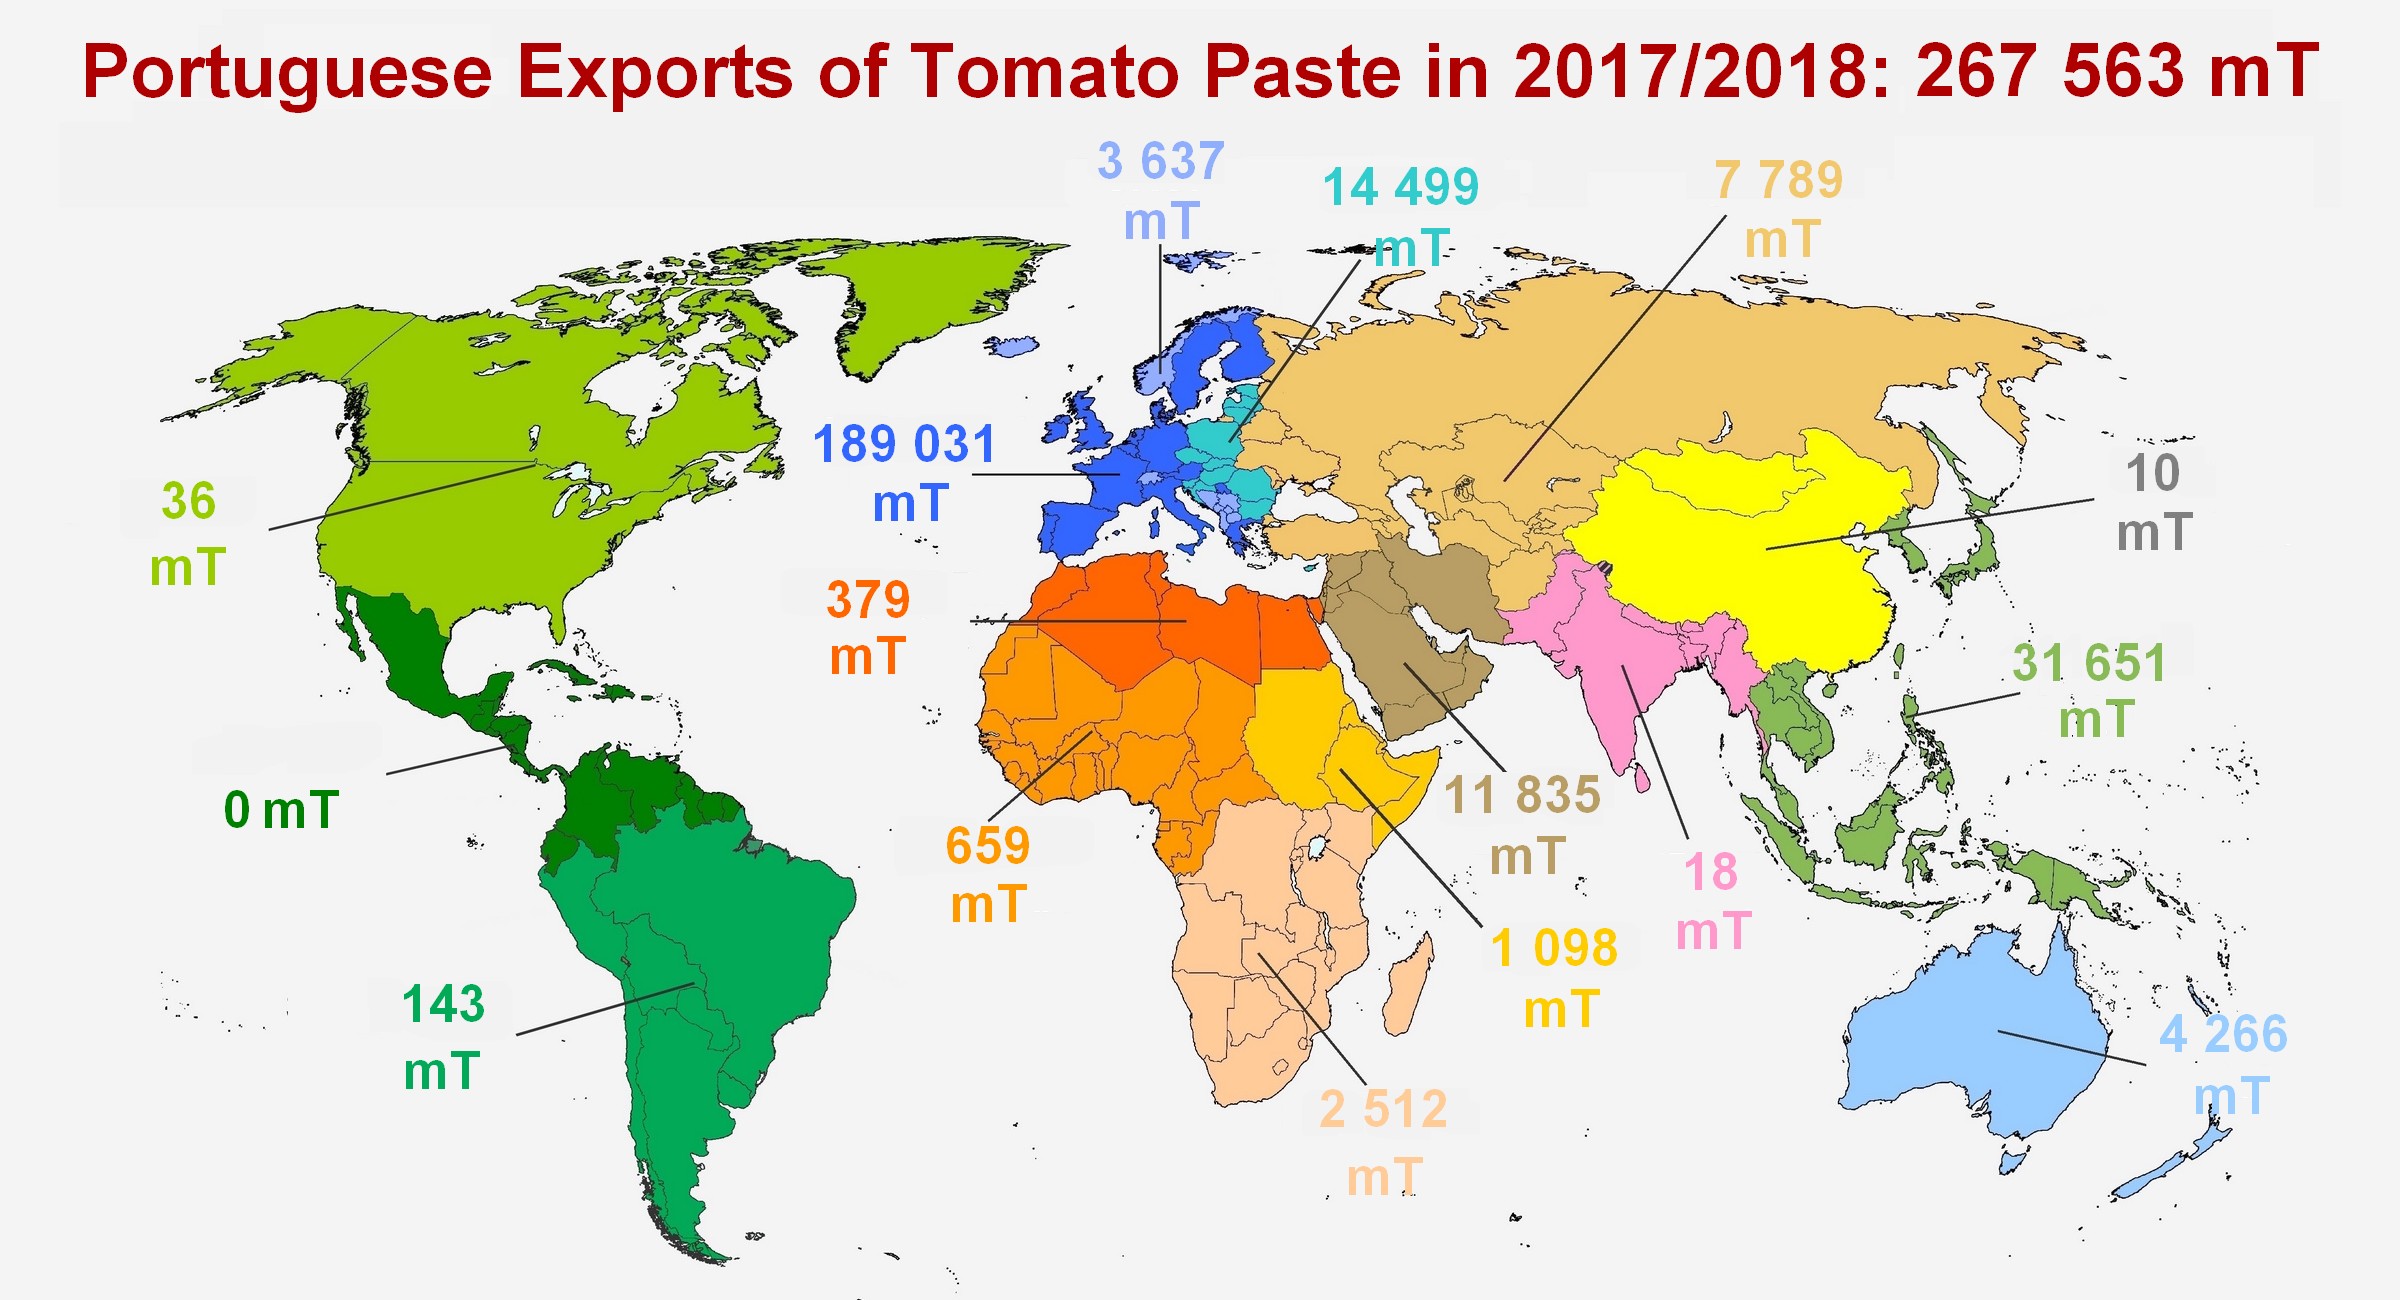
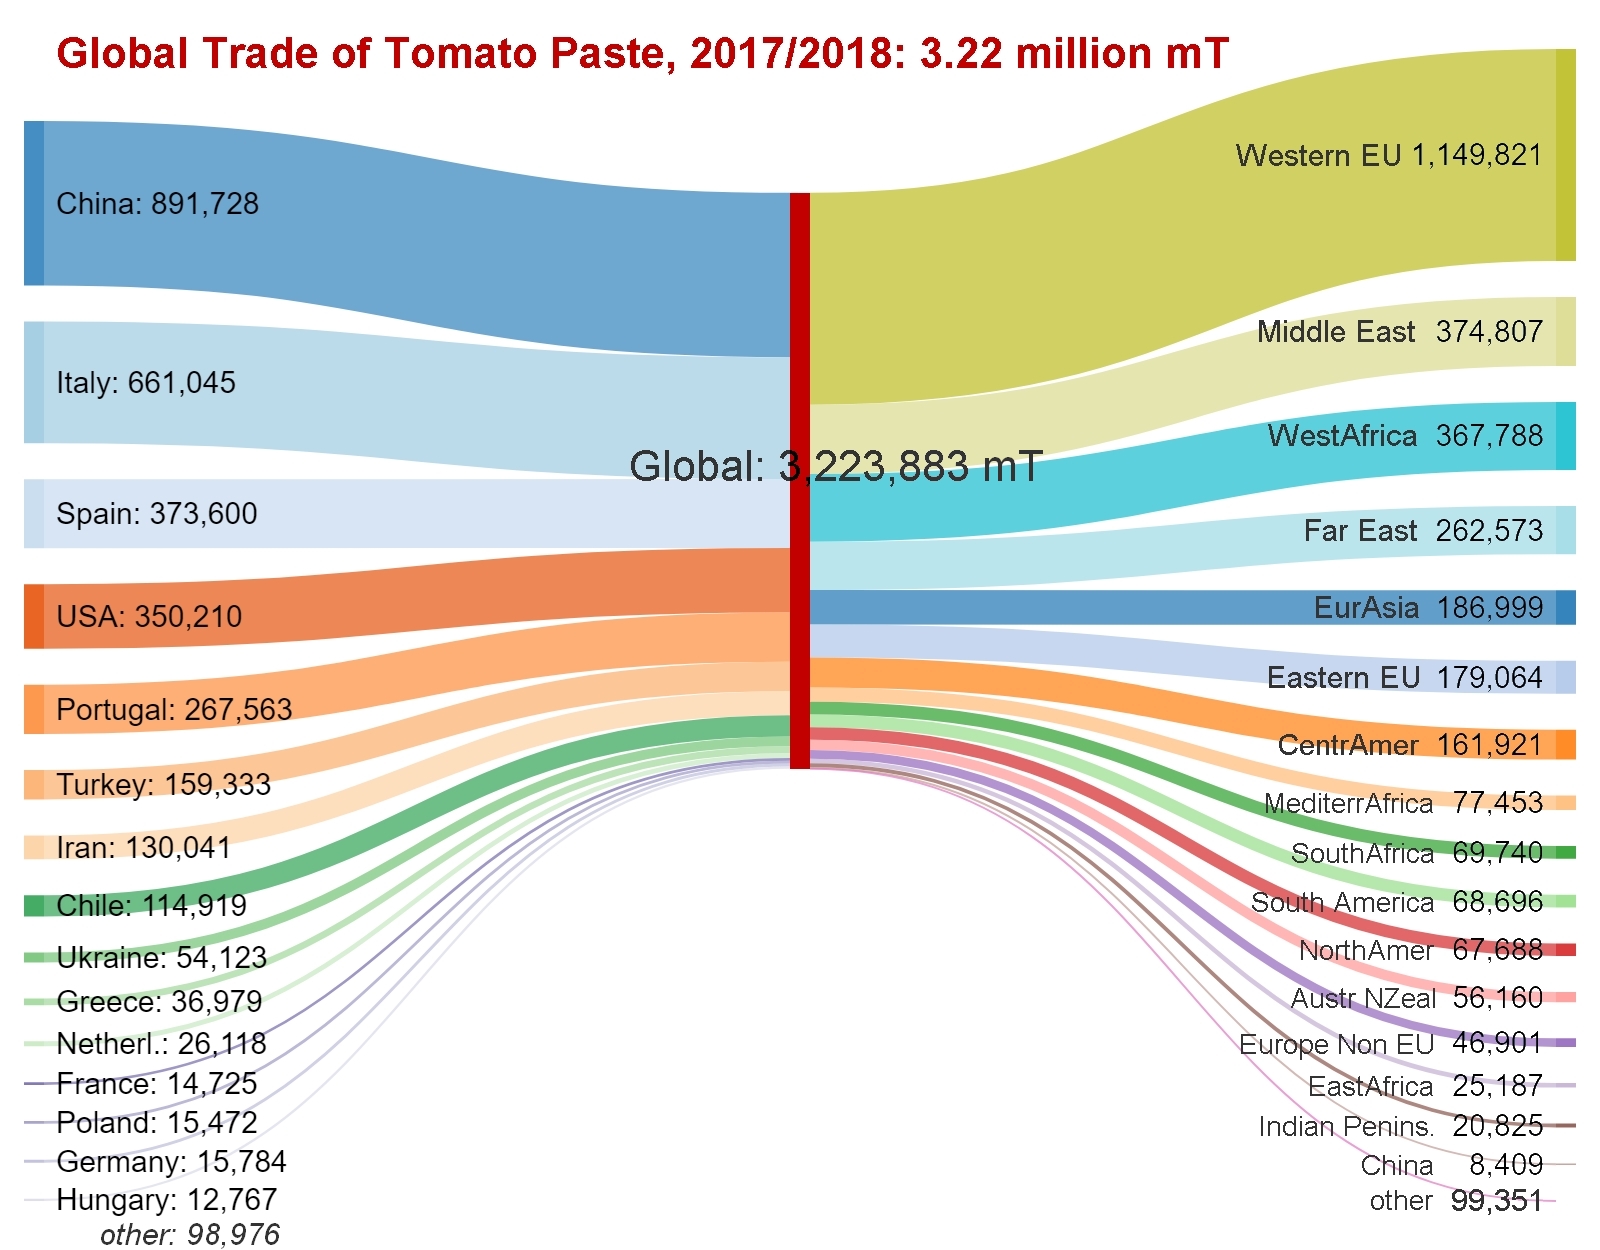
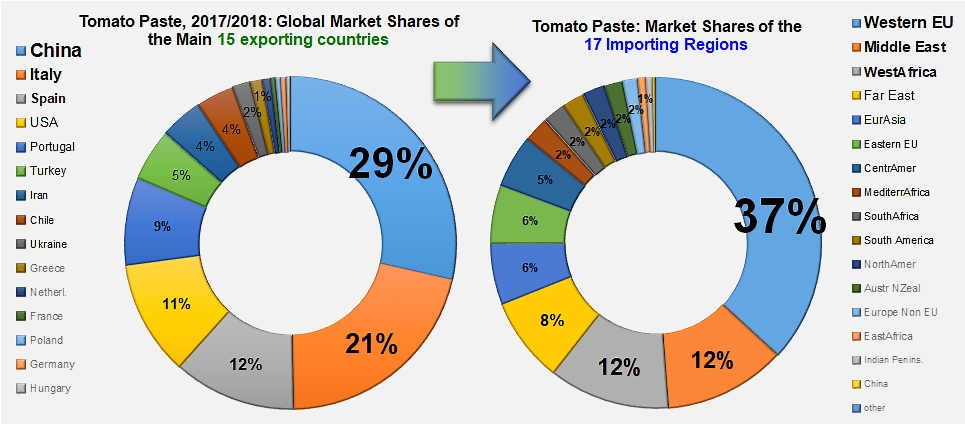
In 2017/2018, like in 2016/2017, the 15 main paste exporting countries accounted for 97% (3.12 million mT) of the sector's global trade (3.22 million mT). The only notable difference in the composition of the TOP15 list was the entry of Hungary, whose remarkable development as a foreign operator with 12 767 mT allowed it to displace Peru from the 15th position, as that country's volume of exports only reached 12 544 mT last year. For information, the volumes shipped by China over the last marketing year were 70 times bigger than those of Hungary.
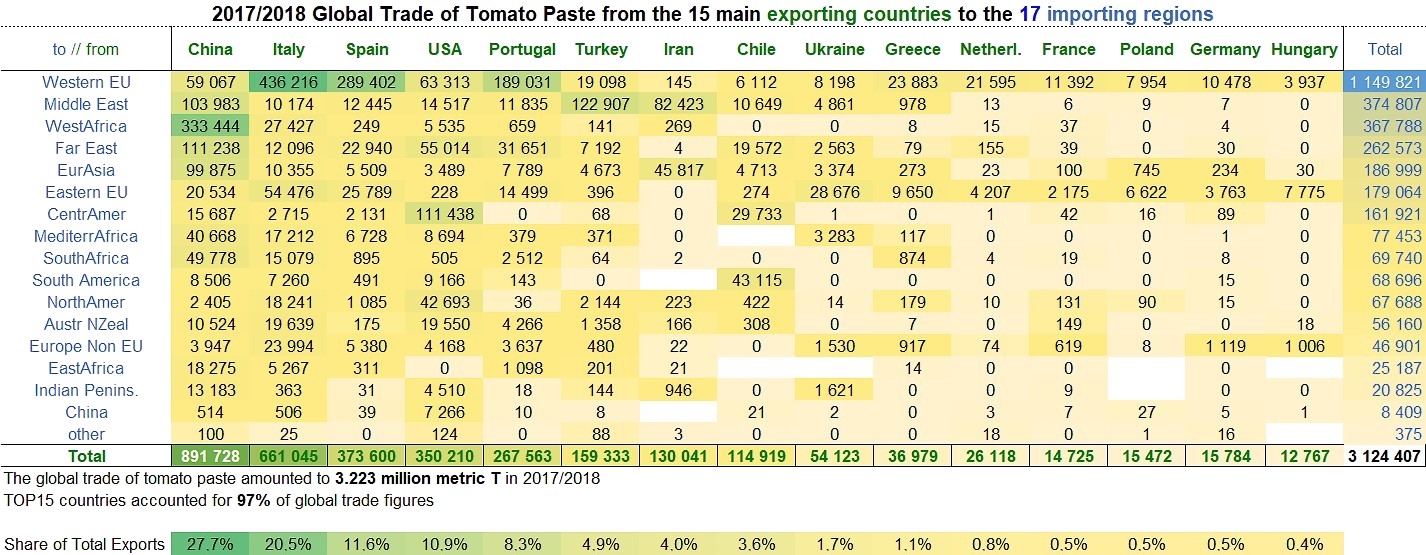
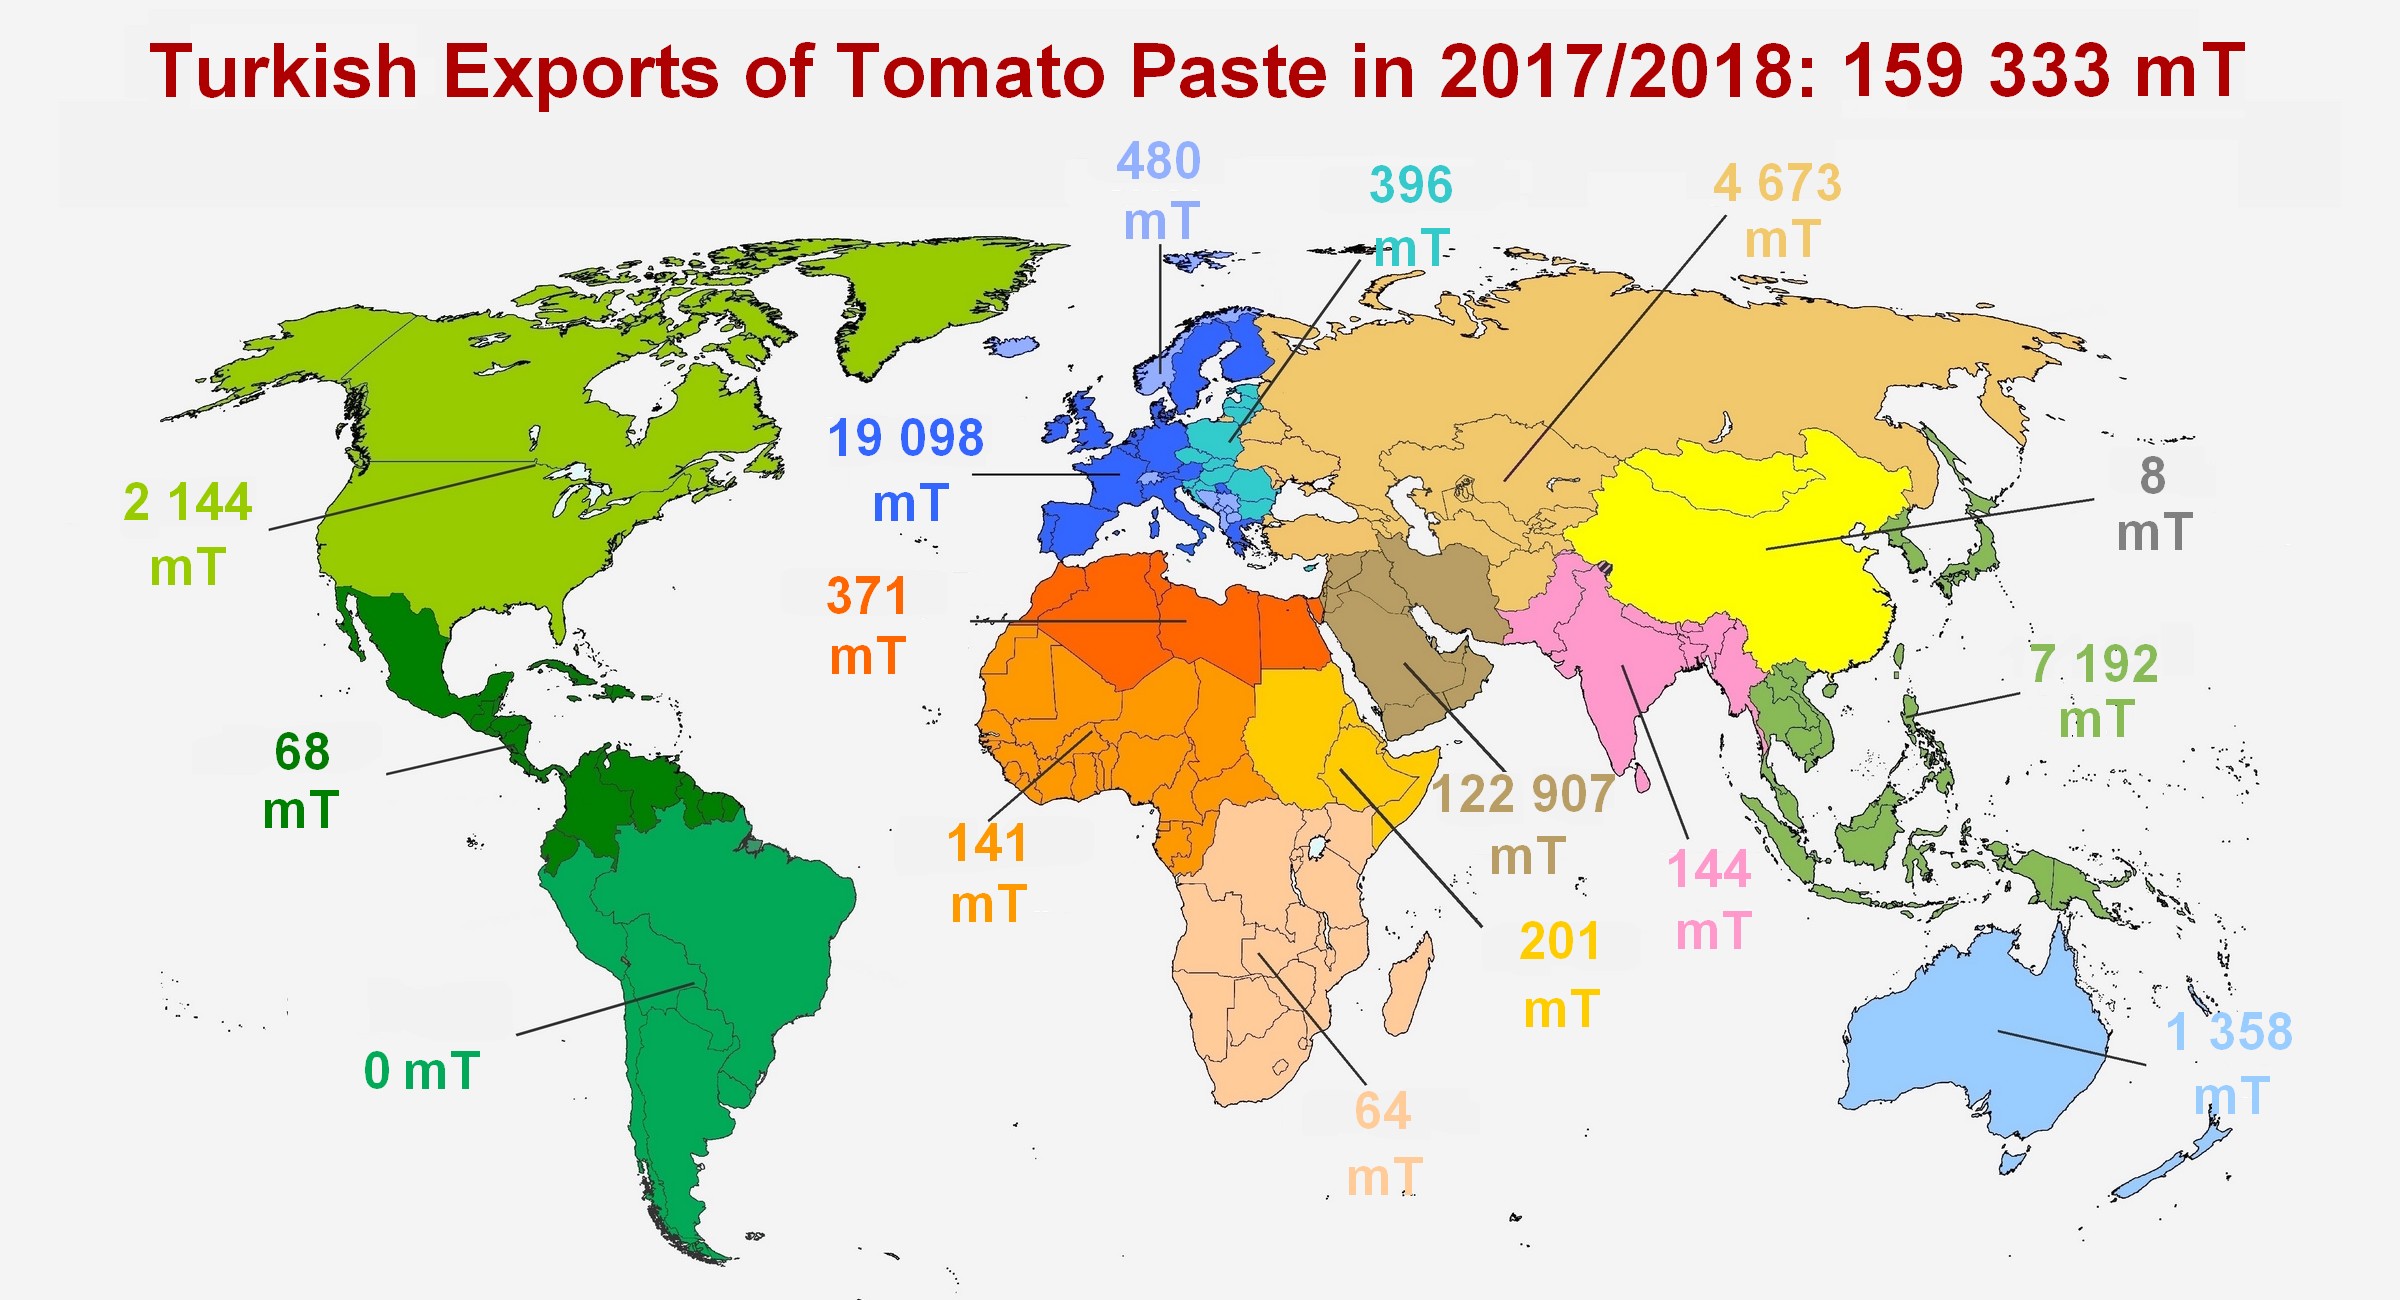
Almost half (1.55 million mT, or 48%) of the volumes exported in 2017/2018 involved products originating in China or Italy. This proportion climbs to 79% of all worldwide trade when it includes the volumes shipped from Spain, the USA and Portugal (991 000 mT). Foreign trade recorded by Turkey, Iran, Chile, Ukraine and Greece, within a more limited geographical context, accounted for approximately 15% (about 495 000 mT) of the total volume. The volumes exported by the smaller operators of the sector (Netherlands, France, Poland, Germany and Hungary) amounted to about 85 000 mT (2.6% of the worldwide total).
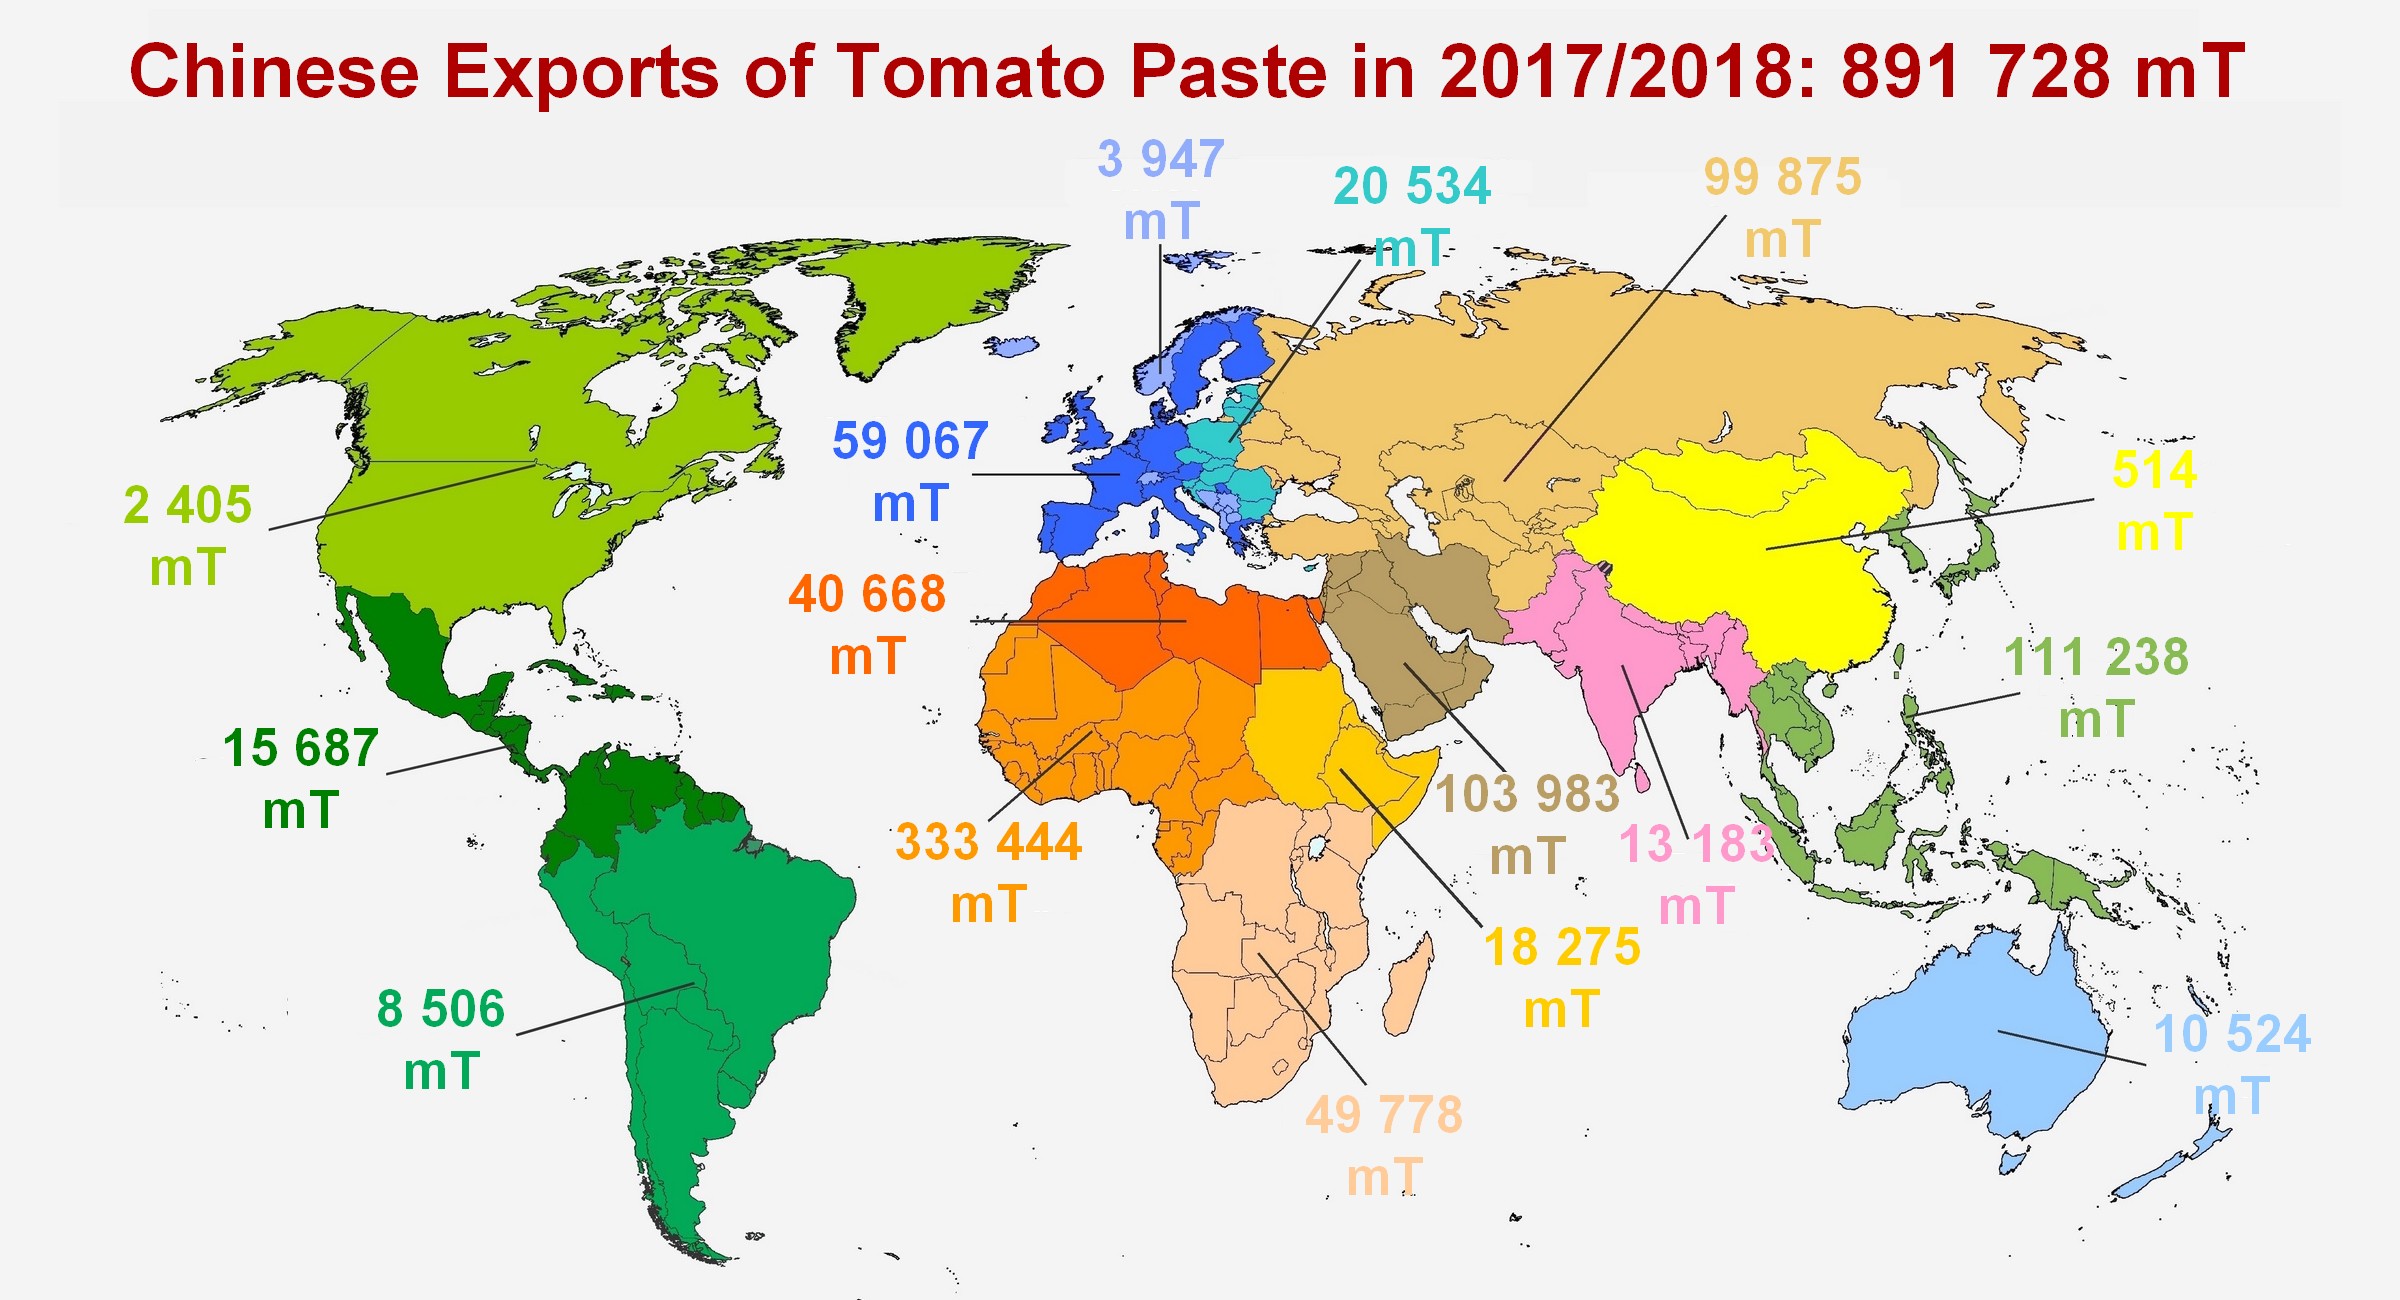
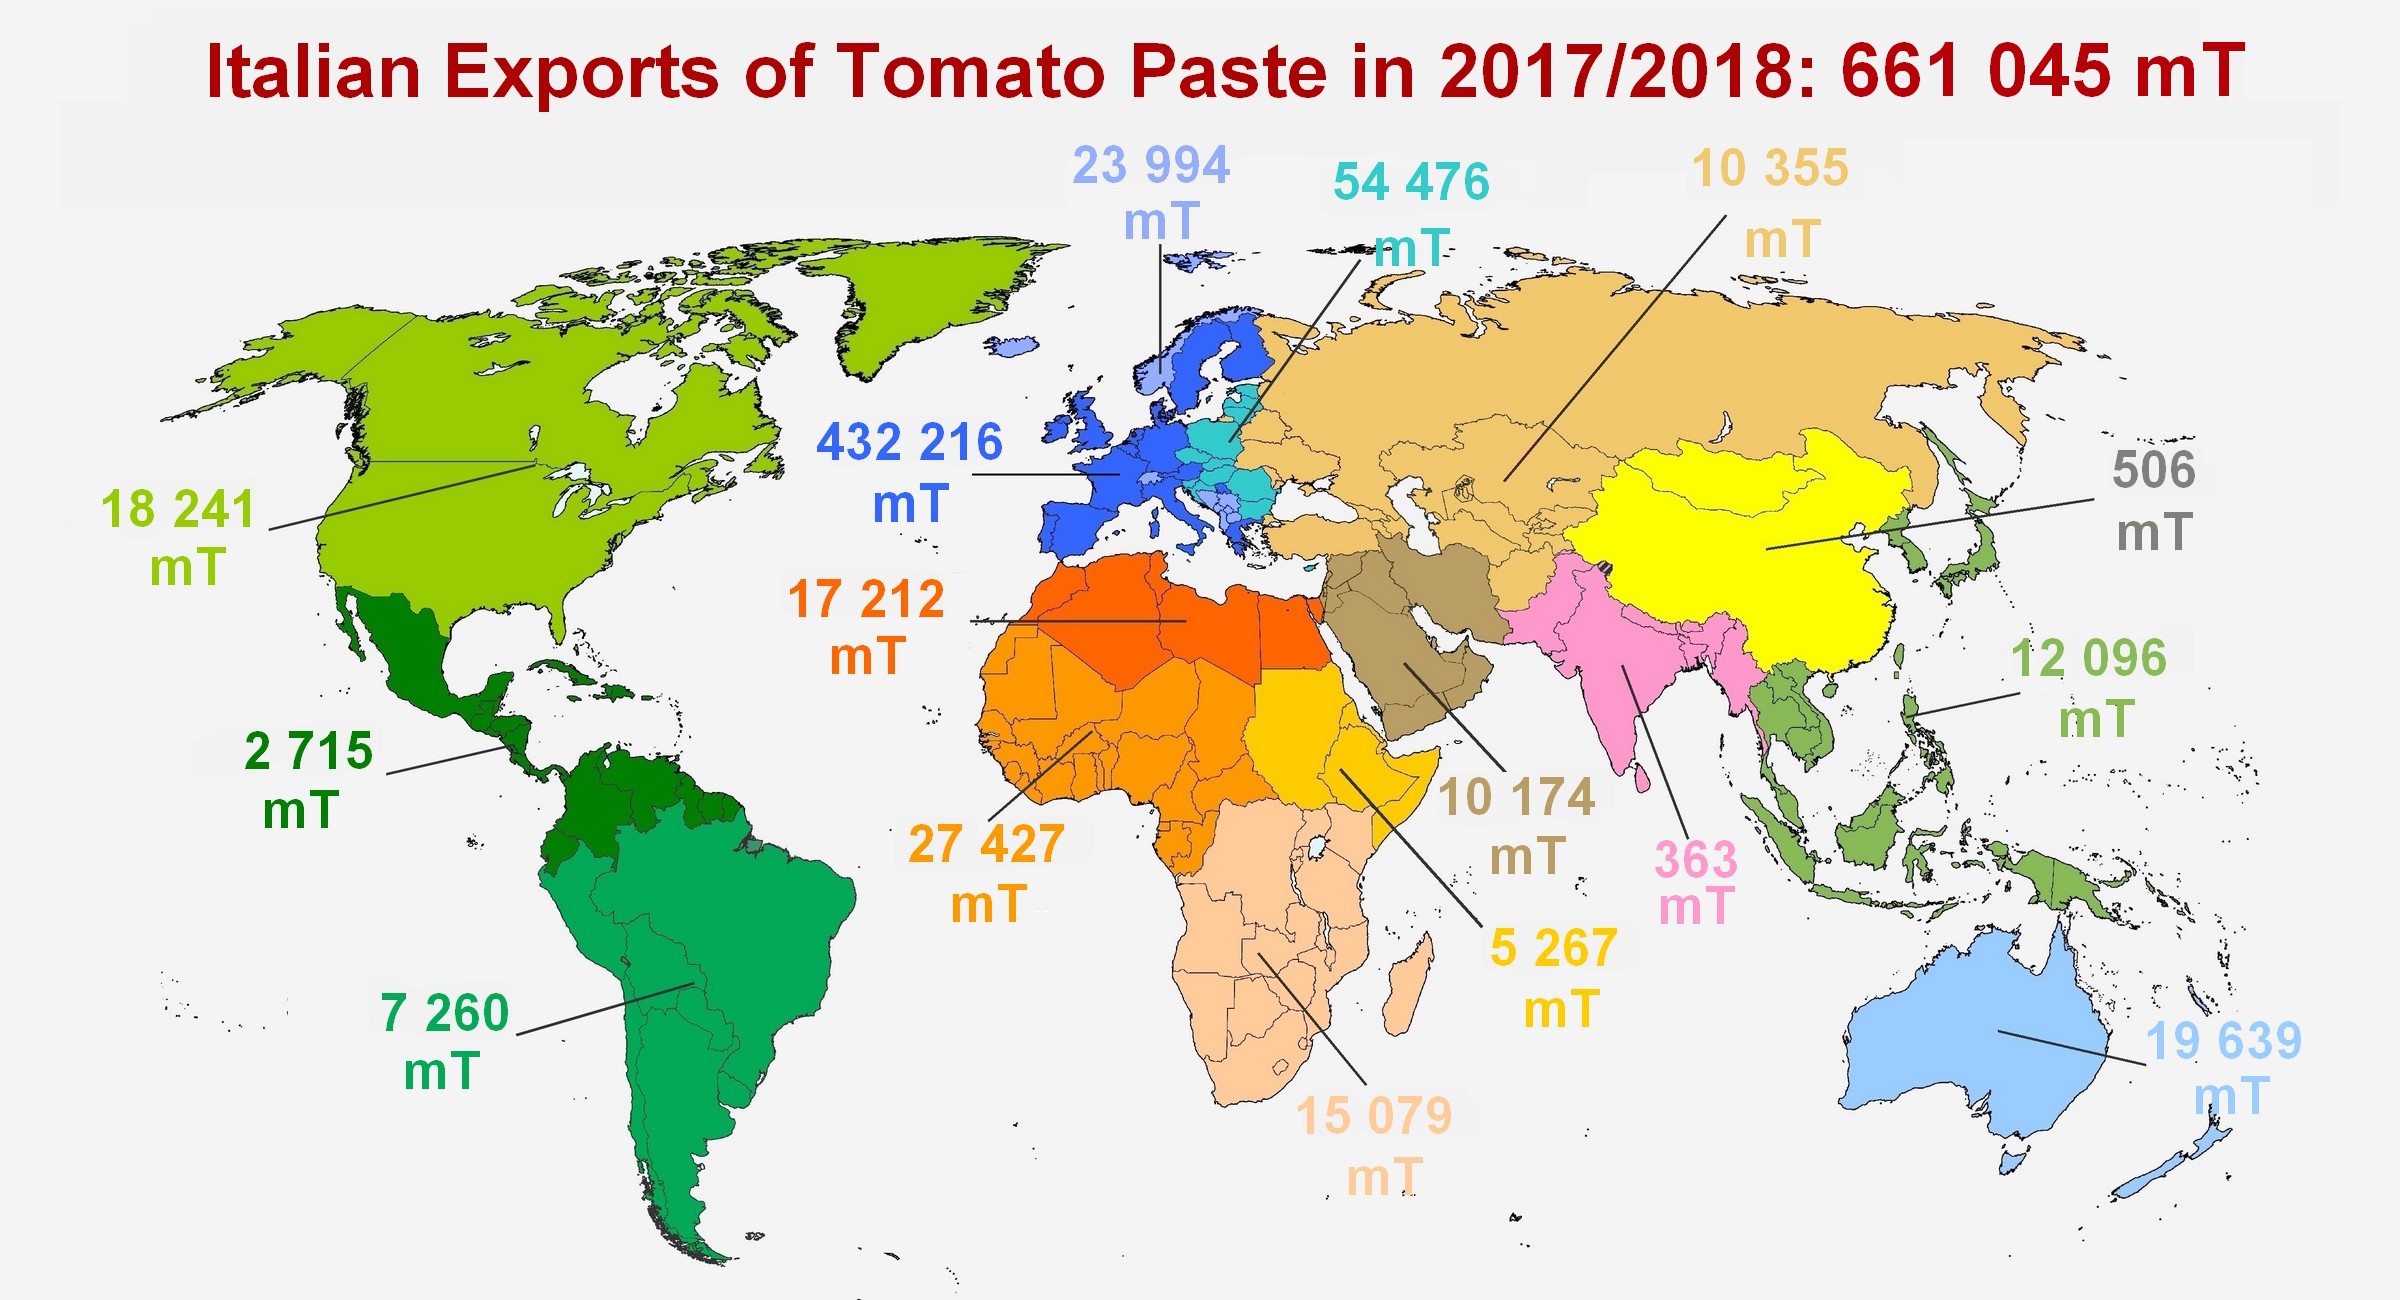
The result of the 2017/2018 marketing year is slightly down on the result of the previous year: last year, worldwide paste export operators shipped almost 37 000 mT less than they shipped in 2016/2017. Indeed, big fallbacks in imports were recorded for Mediterranean Africa (-77 200 mT), Eurasia (-26 000 mT), South America (-24 000 mT) and the western part of the European Union ("EU15") (-16 400 mT). Italy's foreign trade was penalized by the drop in Libyan purchases, while foreign sales recorded by China, Spain and the USA were all affected by the spectacular drop in Russian purchases (in a context that saw that country develop its own production and processing operations). In South America, the drop in Argentinian imports and, to a lesser extent, in Brazilian ones, has had a negative effect on Chilean and Chinese export performances. Finally, US and Chinese foreign trade results have paid the price for the decreases and shifting patterns in Italian purchases, but also in the paste imports of countries like the UK, Germany or the Netherlands...
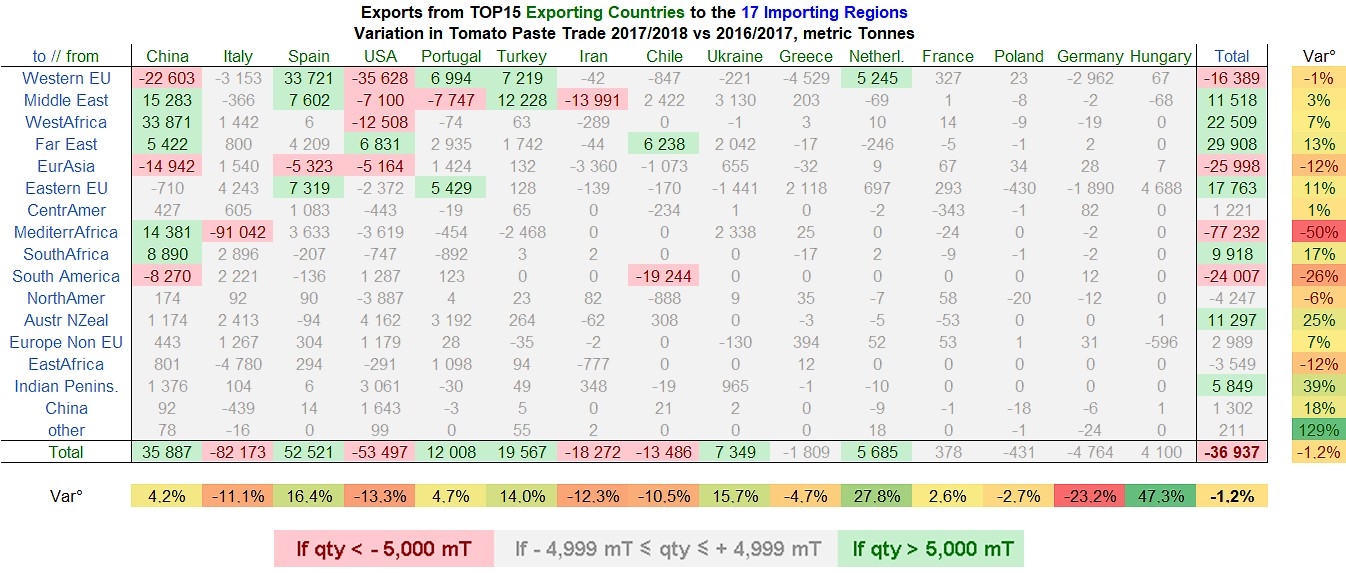
These changes in the origins of products imported into certain countries of the EU15 mainly benefited Spain (+33 700 mT), Turkey (+7 300 mT) and Portugal (+7 000 mT). Other shifts in supply sourcing patterns have been recorded for West Africa, the eastern part of the European Union ("EU13") and the Middle East, to only mention the main ones, with extra volumes once again benefiting the tomato industries of China, Spain, Portugal, and, to a lesser extent, Turkey, which have in fact resulted in increases in the volumes exported.
In the final count, increases in exports (+114 500 mT) recorded on these markets and on a few others (Far East, Asia-Pacific, Southern Africa and Indian peninsula) have not been sufficient to compensate for the combined decreases recorded during this past marketing year (-151 400 mT), resulting in a slight fallback of 1.2% in terms of volume compared to the previous year.
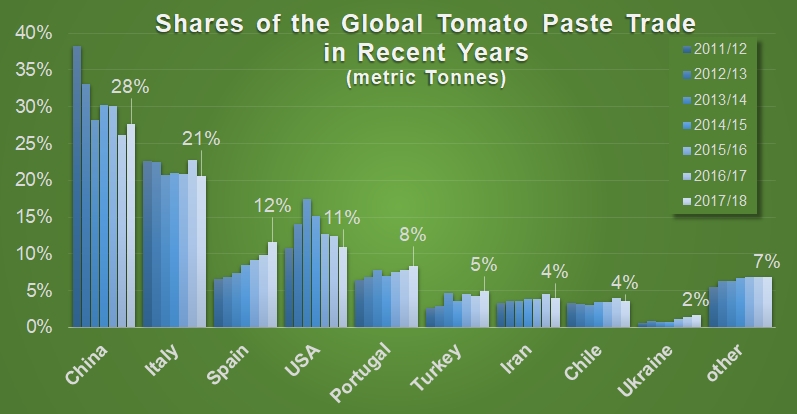
In total, over the past seven marketing years, the influence of China on the worldwide tomato paste market has taken a considerable knock (falling from 38% of the category's worldwide trade in 2011/2012 to less than 28% last year). China’s main challenger on the paste market is Italy (the world's biggest exporter of tomato products overall), which has done its best to maintain its global market share at about 21%. After several years of growth, Spain climbed into third position worldwide last year (at the expense of the US industry, which has suffered on the global market) with 12% of total exports for the period, a rank that it had not occupied since 2006/2007. The US performance fell back once again and accounted for 11% of the worldwide total, placing that country, which is the world's biggest processor, in fourth position in the ranking of paste exporting countries. Portugal recorded major growth, reaching 8% of overall global exports, which placed it in fifth position in this ranking, ahead of Turkey, whose foreign sales nonetheless recorded a good result in 2017/2018. As for Iran and Chile, these countries saw their results in terms of volume and their global market share fall back during the marketing year.
The canned tomato trade in 2017/2018
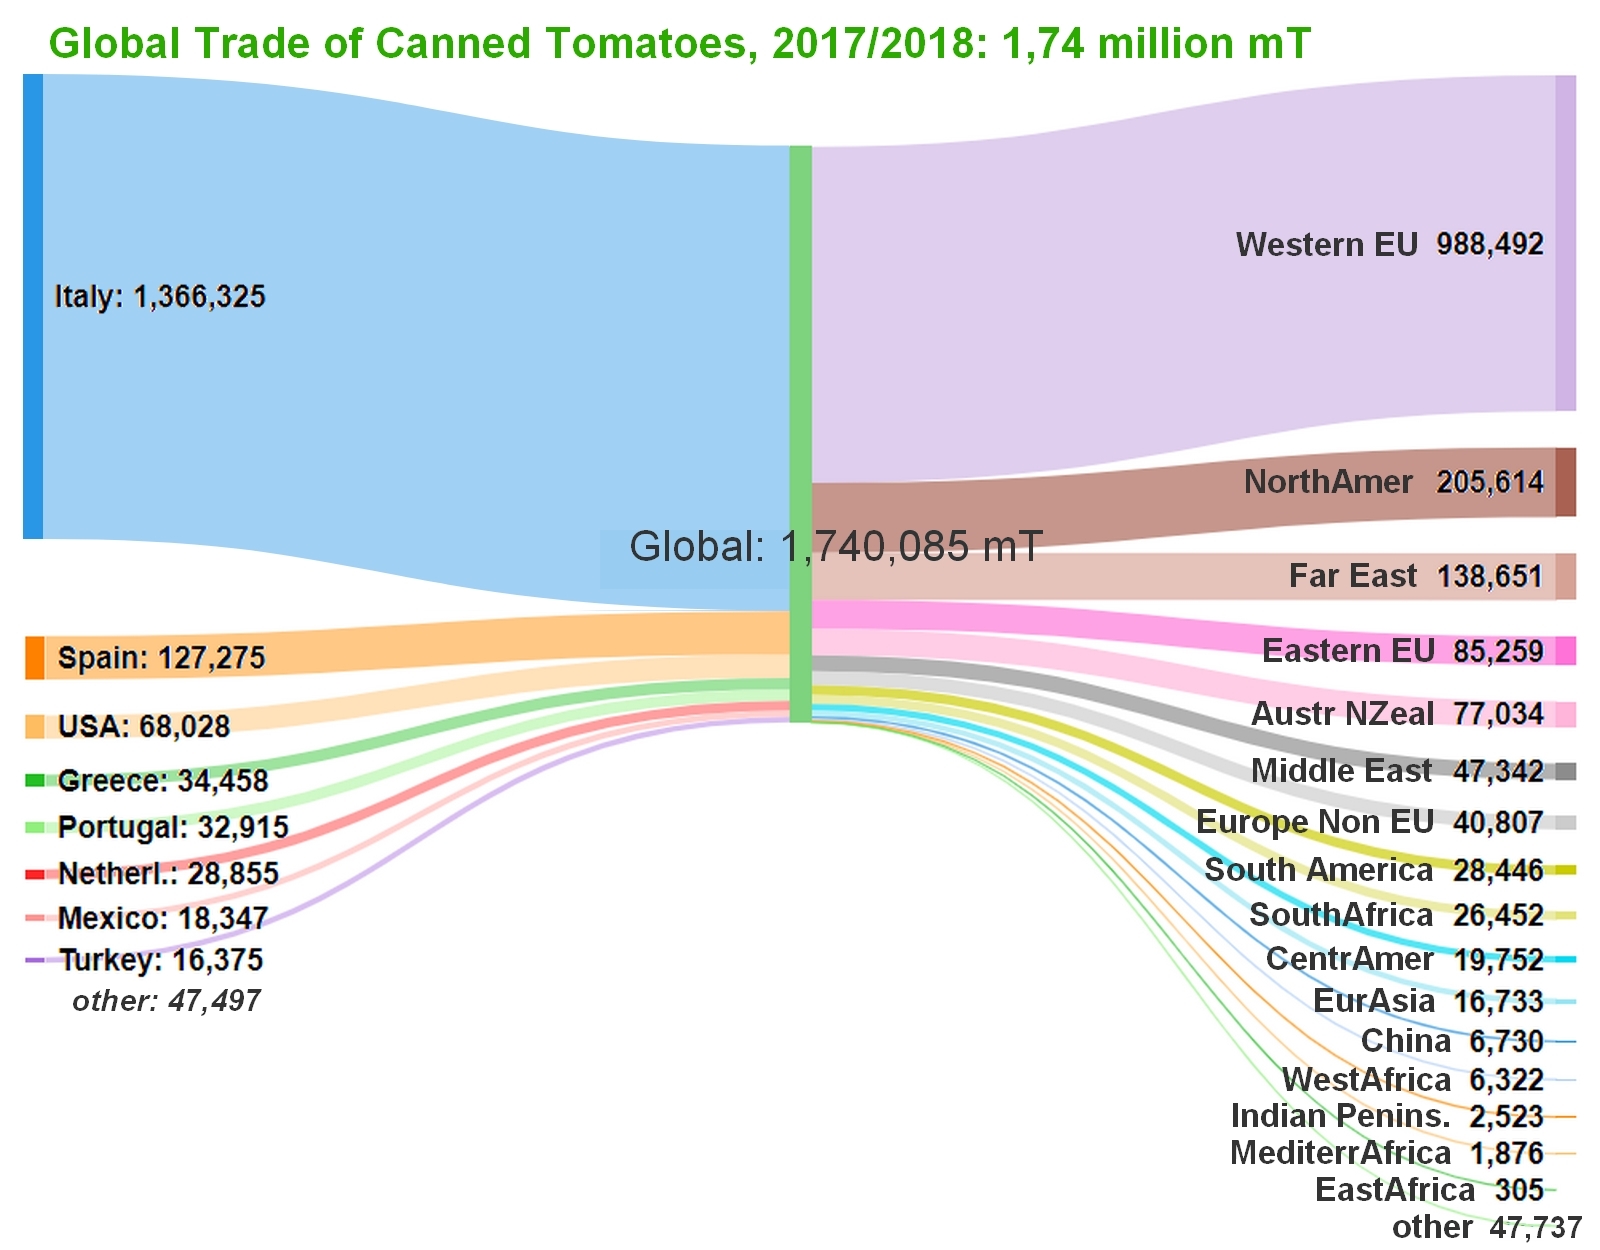
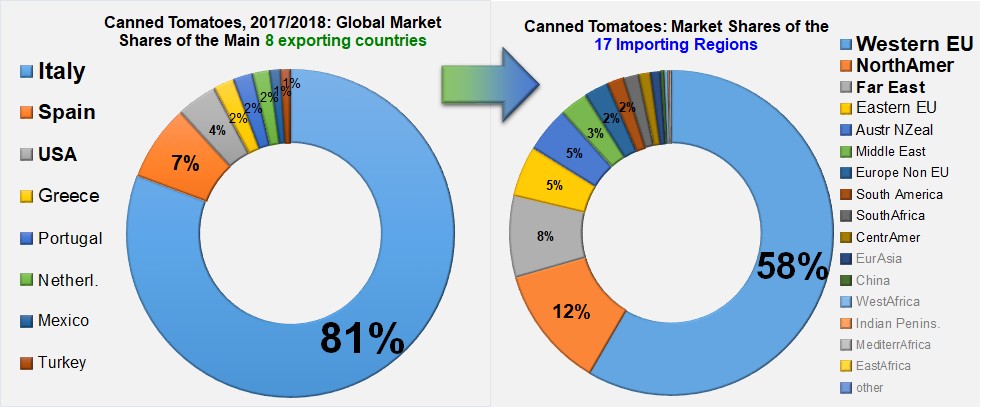
The extreme polarization of the worldwide trade in canned tomatoes, which has been the main feature of this segment for many years, does not seem likely to change in the foreseeable future. Particularly for the operators in the South Central region of Italy, who are the undisputed leaders of the sector, the 2017/2018 marketing year provided the opportunity to consolidate their hold on the global market for canned tomatoes, recovering some of the market shares that they lost in previous years. With 1.366 million mT exported over this past marketing year, Italy accounted for more than 78% of the world's trade in canned tomatoes (1.74 million mT). The biggest challenger to the Italian industry on this market is Spain, whose exports last year amounted to about 127 300 mT, which is eleven times less than the volumes shipped by Italy. The United States, Greece and Portugal also operate in this category as primary first stage processors. However, the combined operations of these three countries only accounted for slightly more than 135 000 mT of finished products in 2017/2018, and slightly less than 8% of the total quantities shipped around the world. The other countries of the world's TOP8 exporters of canned tomatoes (Netherlands, Mexico and Turkey) only accounted for a total of slightly less than 4% of the sector's operations.
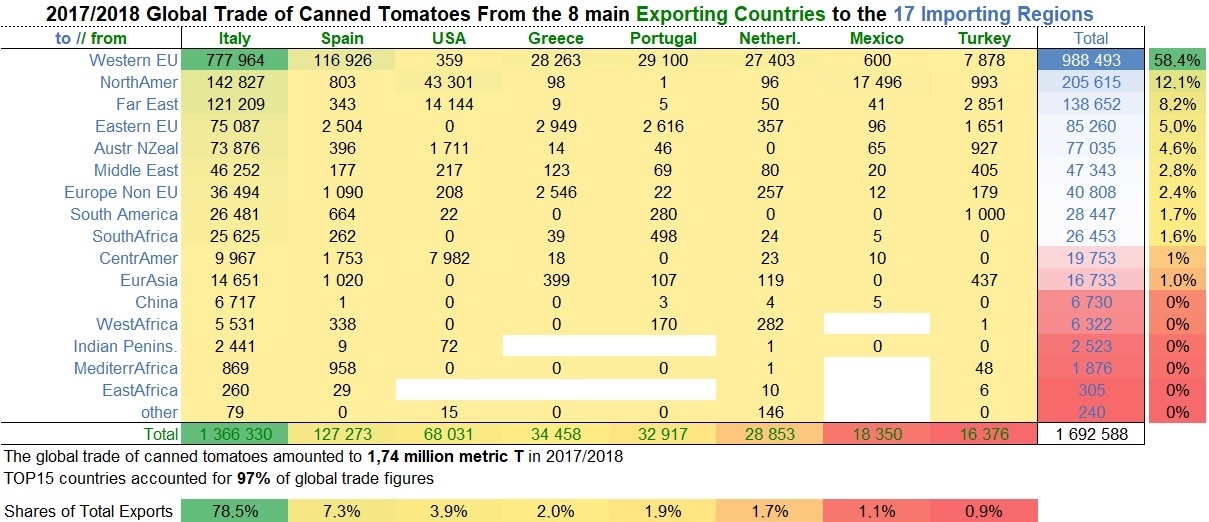
Outlets for this category are particularly concentrated: in 2017/2018, like in previous years, the European Union absorbed 63% of the world's exports of this segment, with the United Kingdom, Germany, France, the Netherlands and Belgium featuring among the main importing countries for canned tomatoes. Purchases by the USA, Canada, Japan, Australia, Saudi Arabia and, to a lesser extent, Switzerland and Brazil, make up the rest of the group of countries that consume a lot of canned tomatoes.
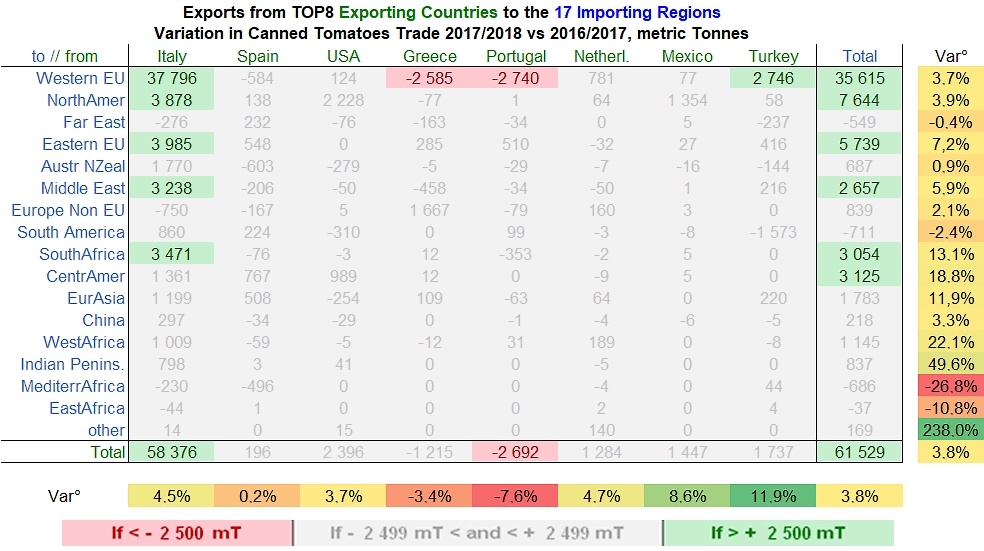
Results for the 2017/2018 marketing year demonstrate a notable increase of 59 200 mT worldwide (3.5%) and of more than 61 500 mT just for the eight leading countries of the category. This performance is mainly driven by the increase in Italy's foreign trade, which alone added close on 58 400 mT (+4.5%) to the total of global trade for the year. Most of the markets already mentioned as being among the biggest at the worldwide level – except for the Far East, which is not particularly significant – are among the destinations that have increased their supplies during the past year. Purchases from the EU15 recorded an increase of more than 35 600 mT, which is proportionally smaller than those recorded for North America (+3.9%), the EU13, South America, etc.
Despite the stated ambitions of Spanish competitors, who have nonetheless managed to take over a noticeable share of the worldwide markets, the dominance of Italian products in this canned tomato category continues to become stronger as the years go by.
Some complementary data
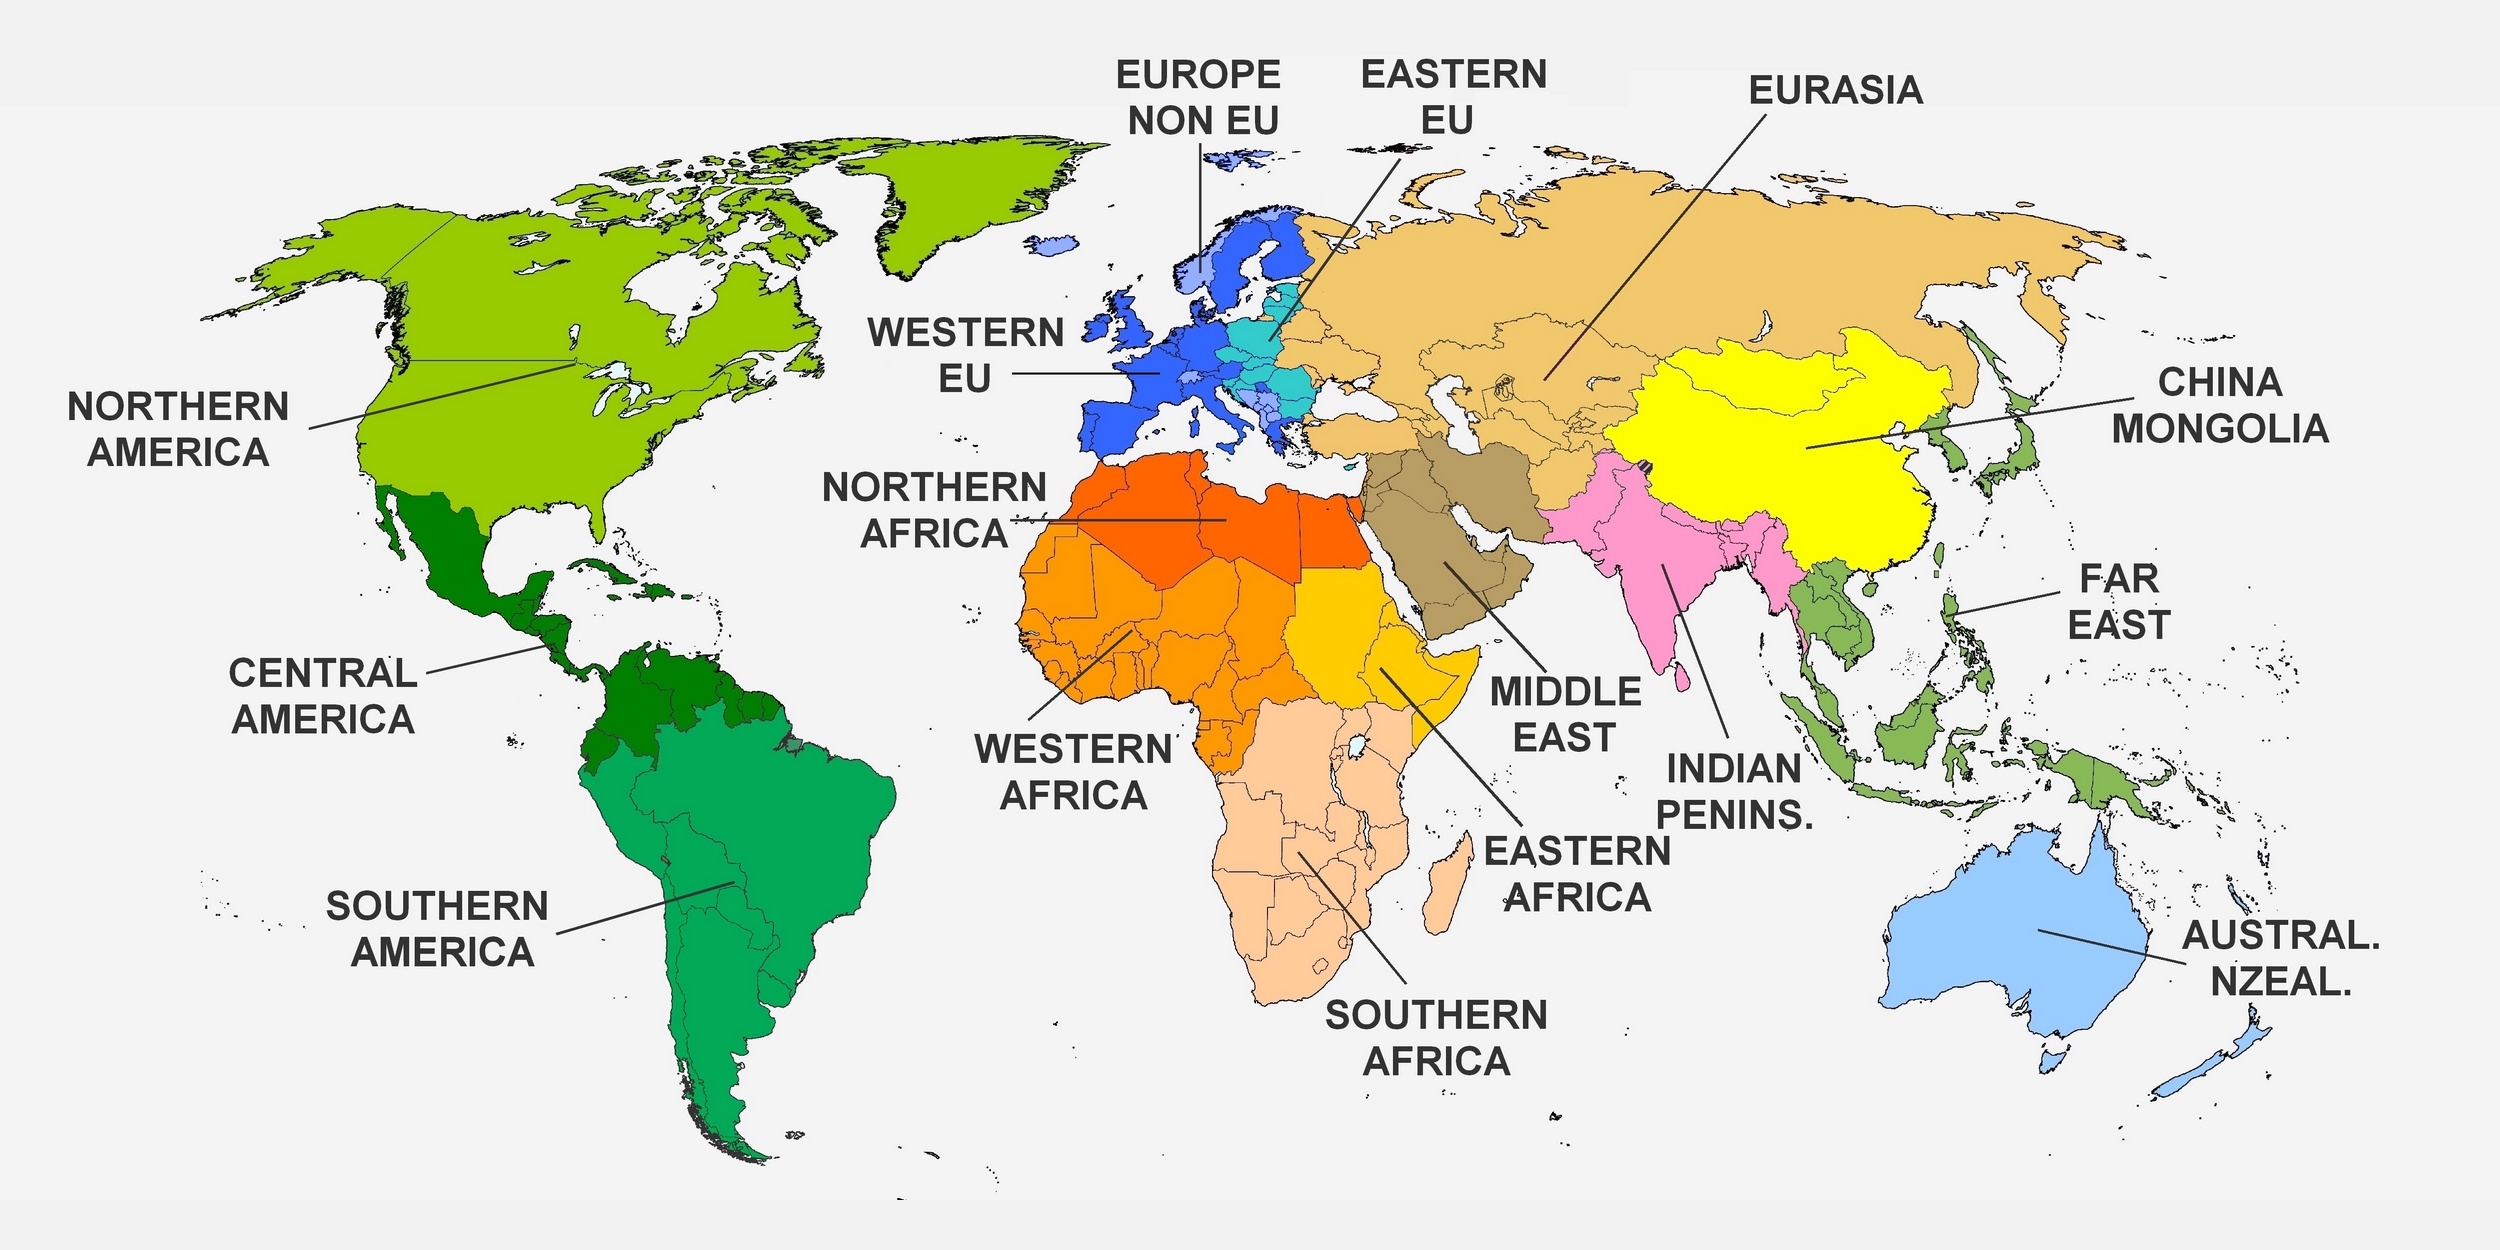
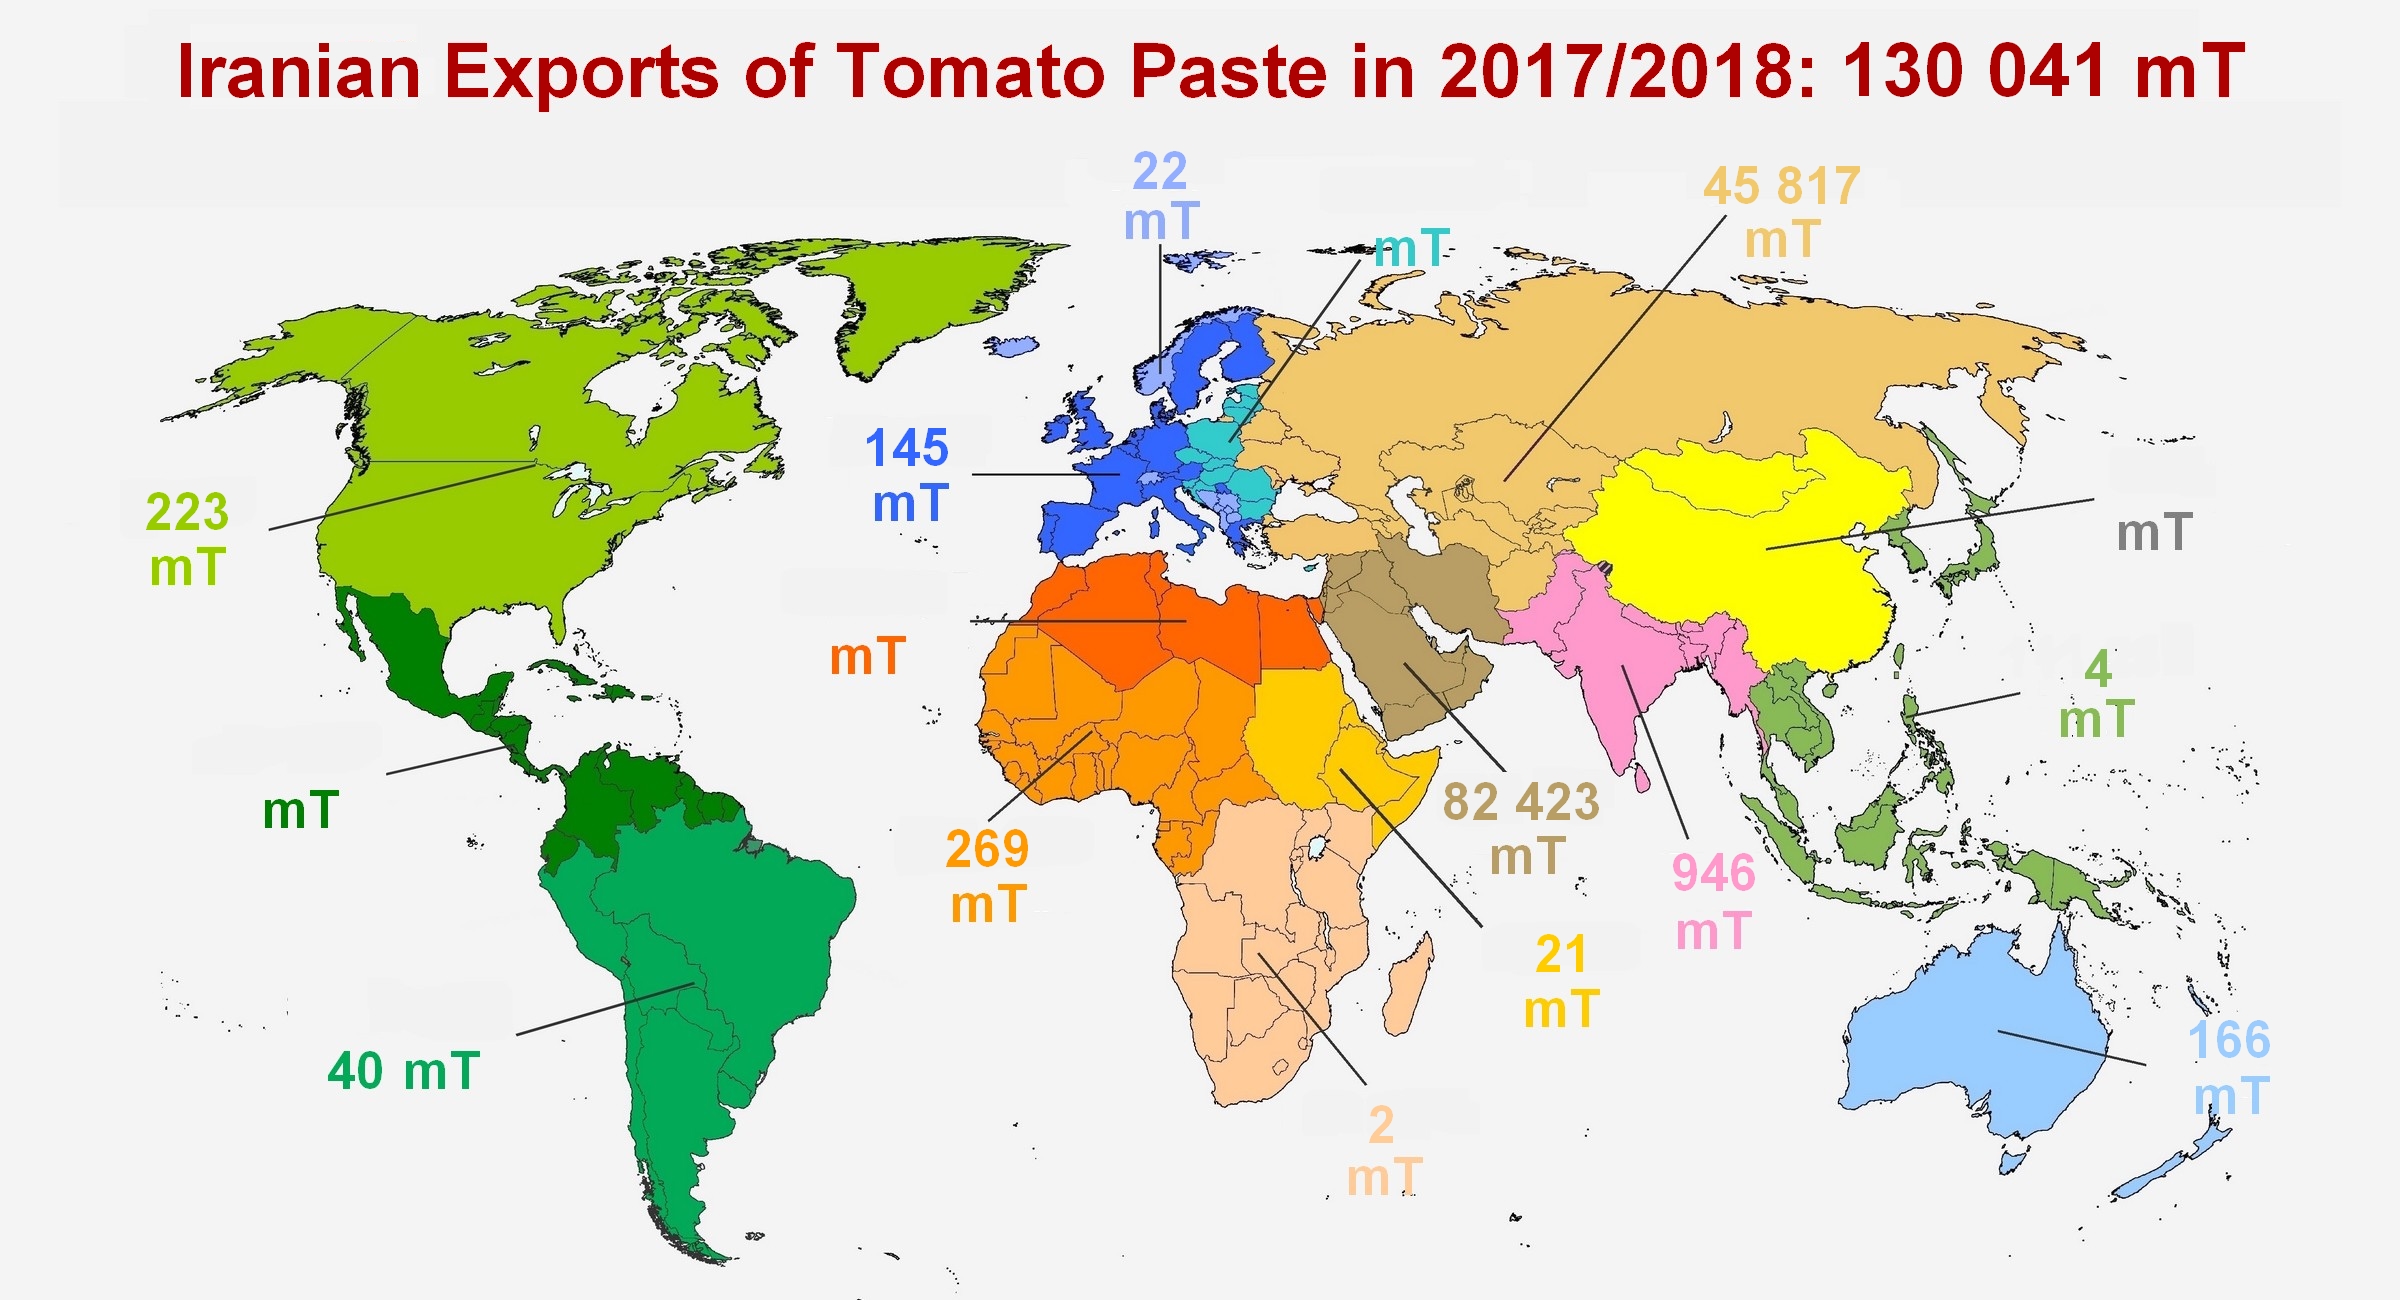
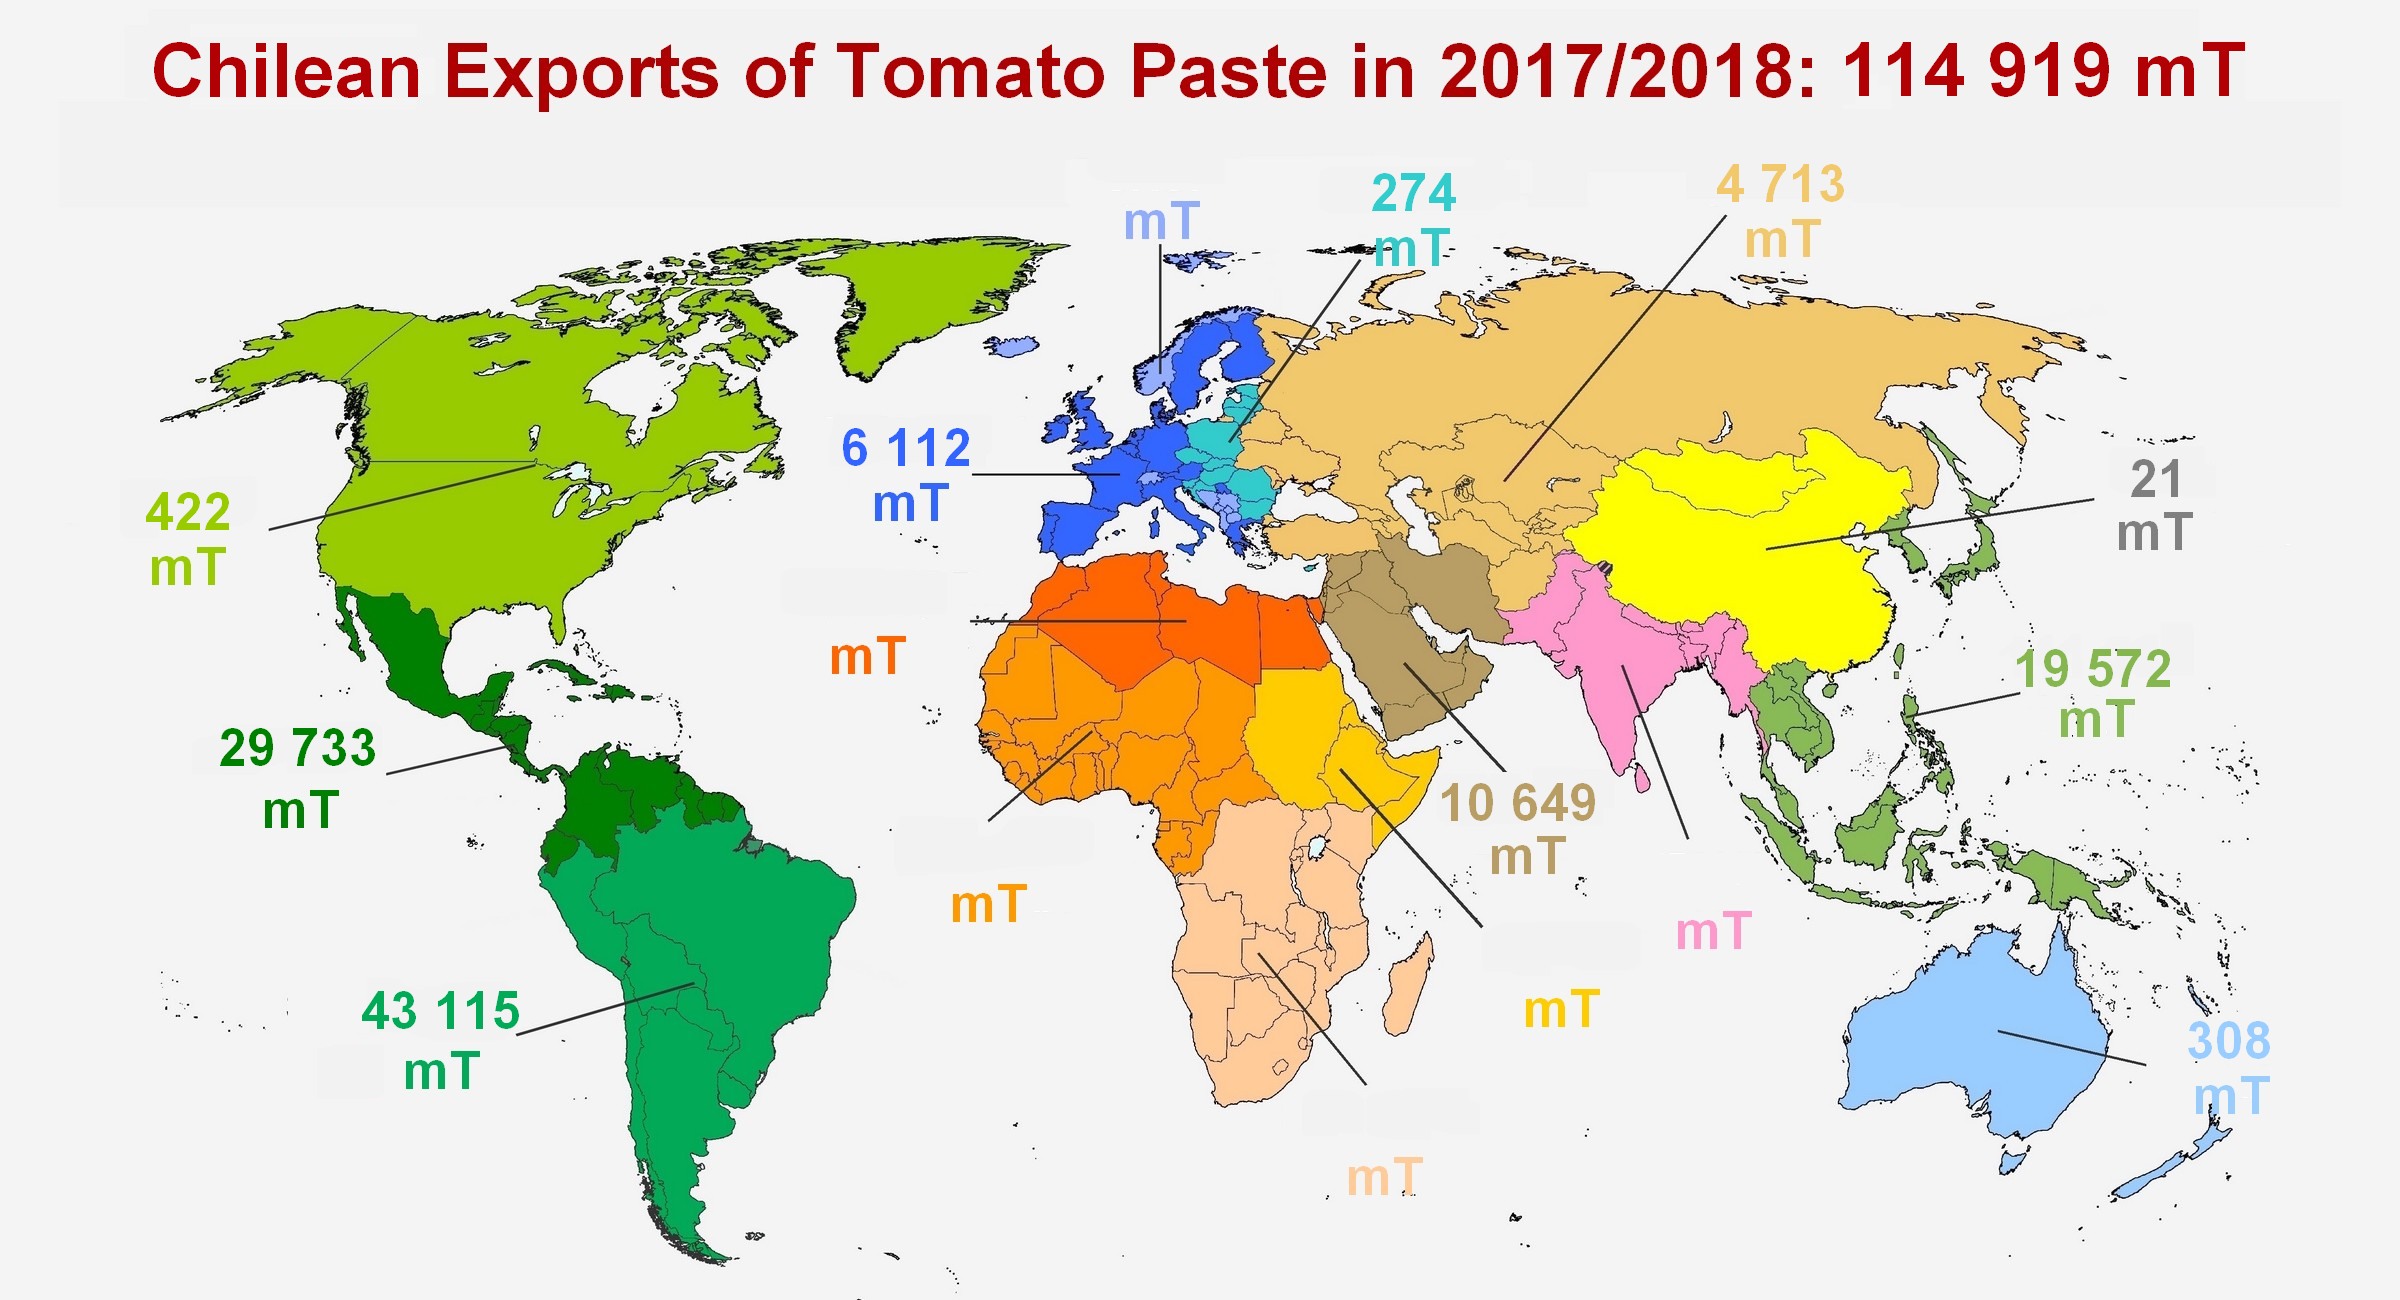
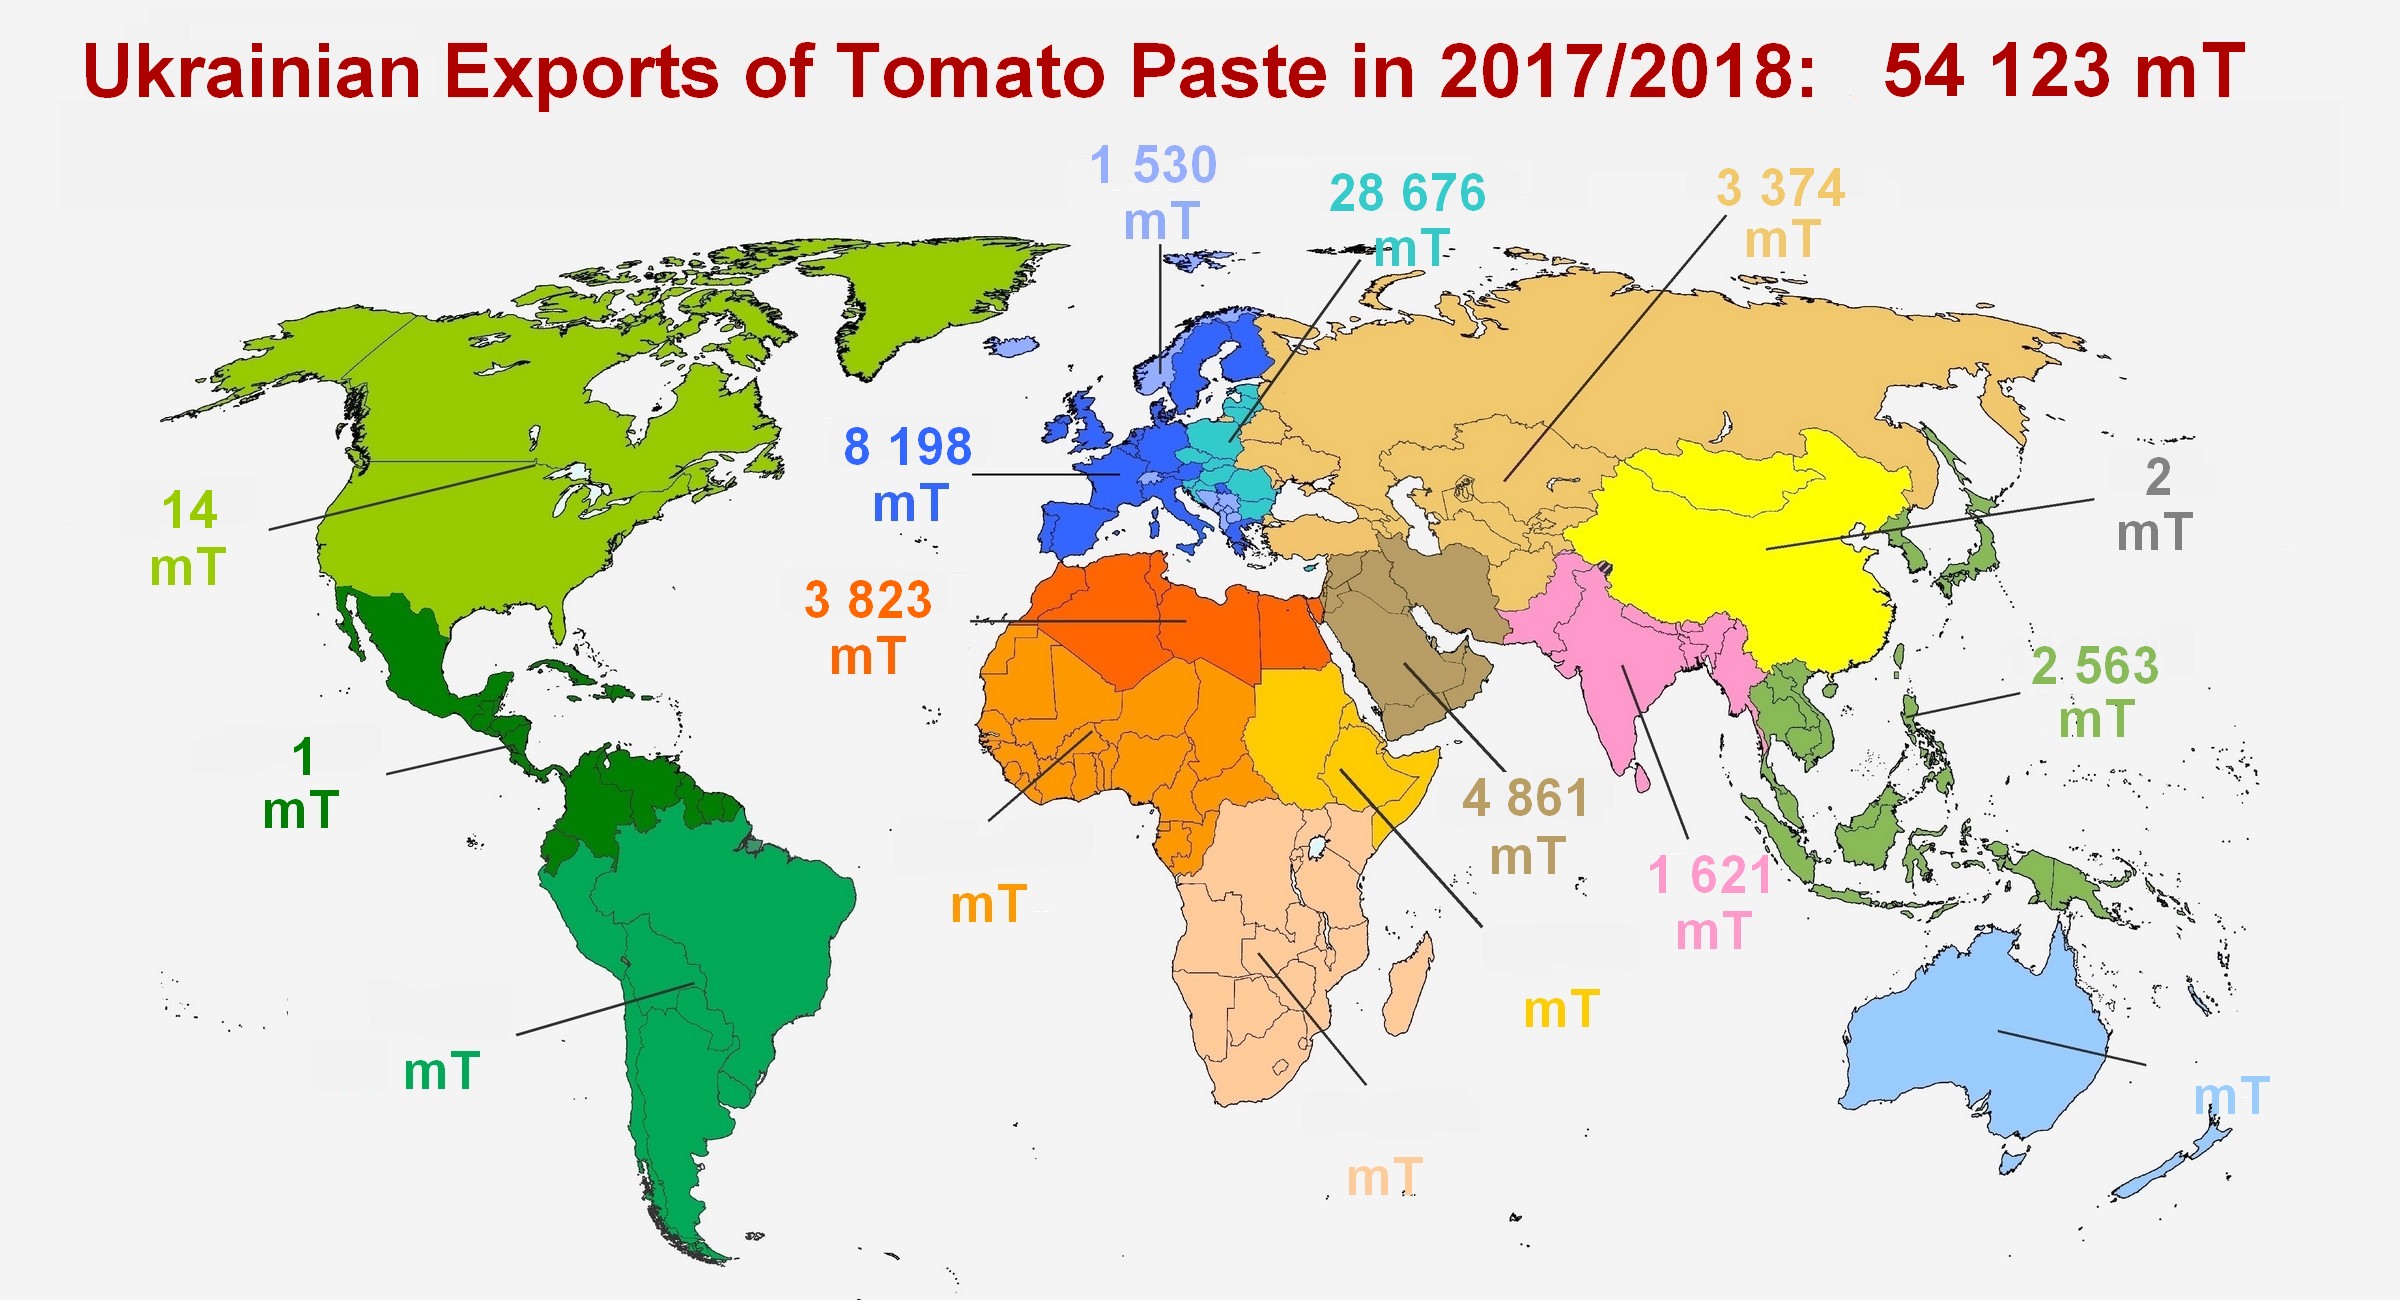
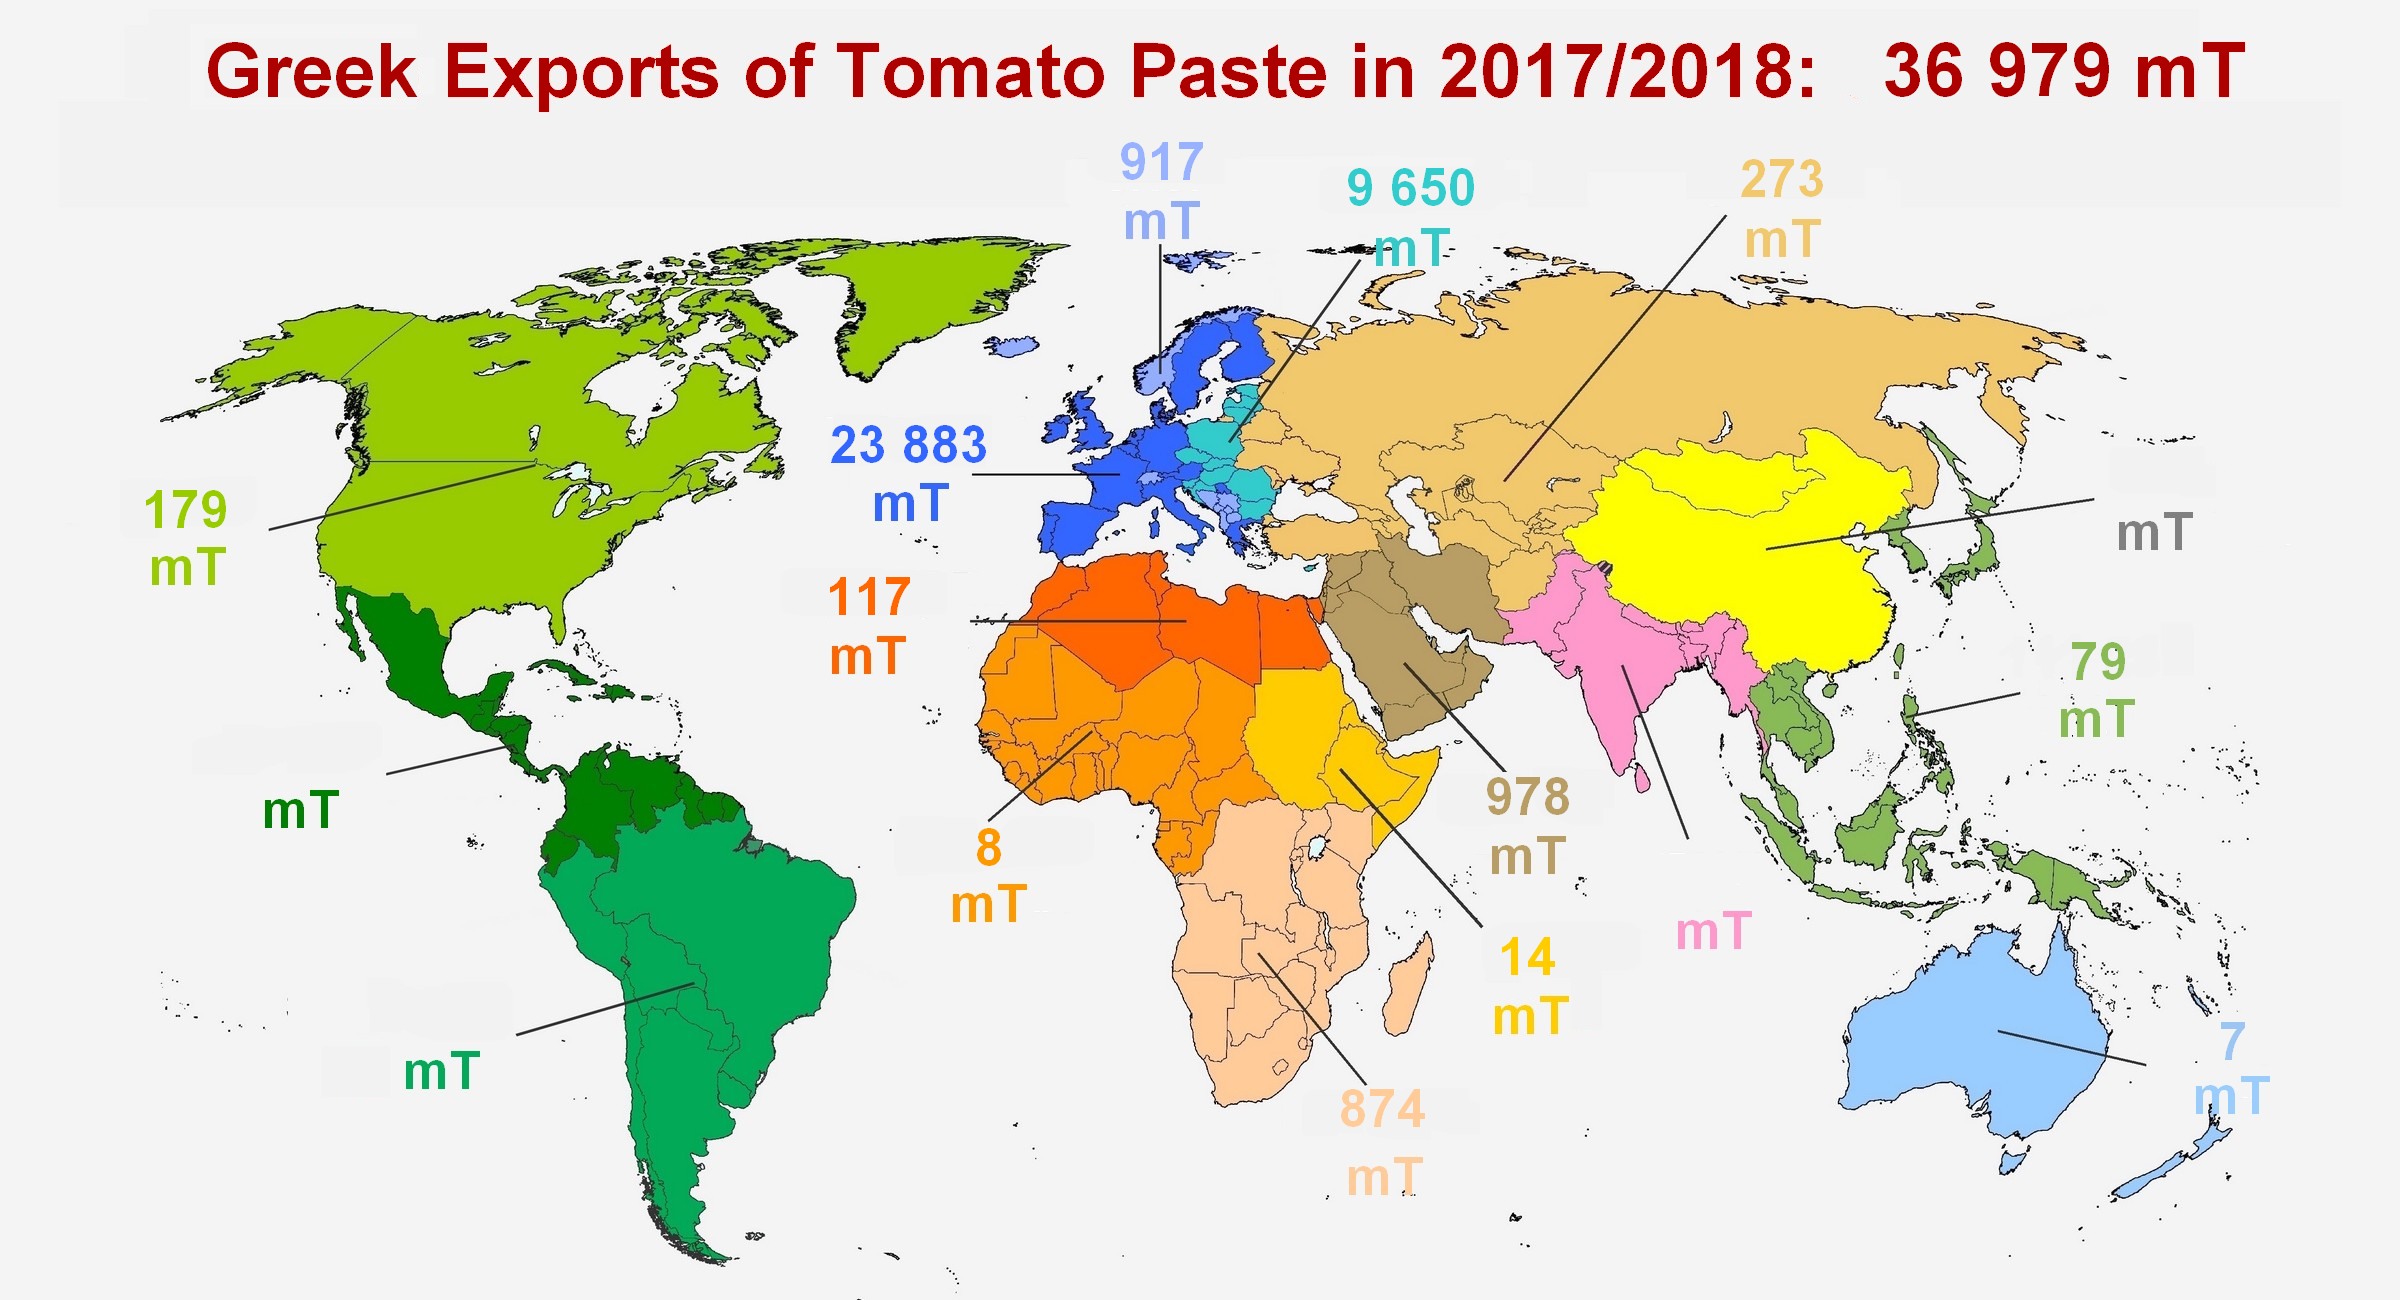
Regional trade divisions, as defined in 2010 by Duncan Blake and FX Branthôme at the Estoril world tomato Congress, and revised at the Athens Congress.
China
Italy
Spain
USA
Portugal
Turkey
Iran
Chile
Ukraine
Greece
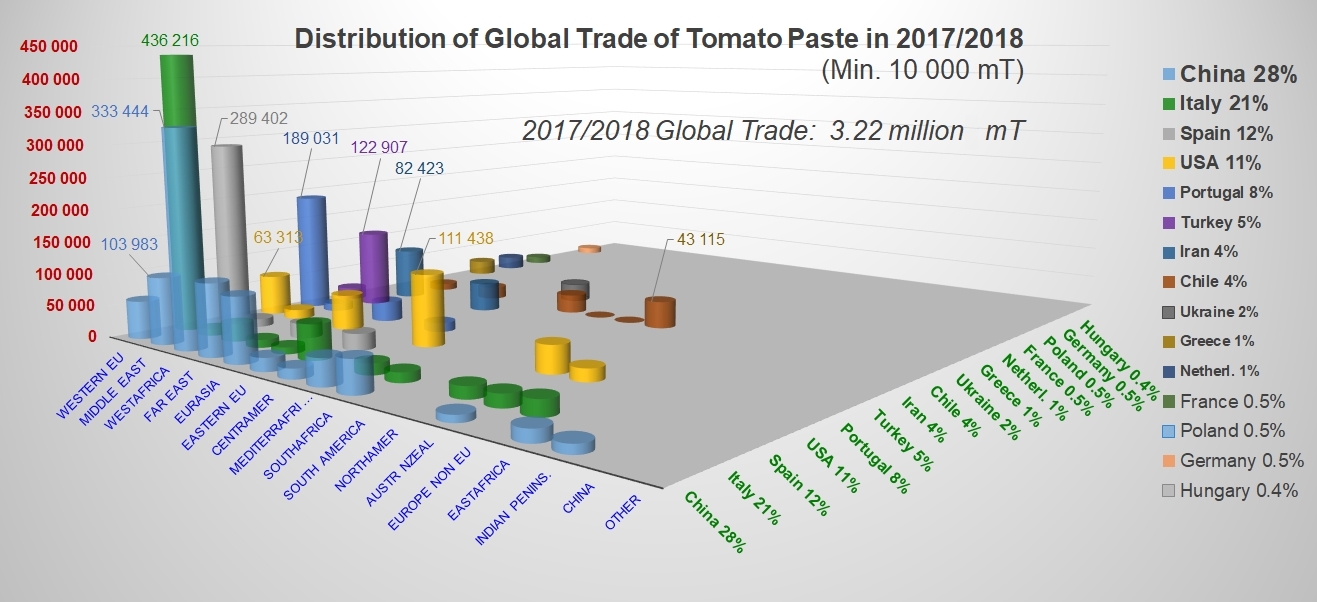
Tonnage figures indicated for suppliers and for destinations are total volumes – the diagram presents all of the paste exchanges for the marketing year.
Tonnage figures indicated for suppliers and for destinations are total volumes – the diagram presents all of the canned tomato exchanges for the marketing year.
Sources: IHS, TDM


